- Print
- DarkLight
- PDF
The Strategy-section consists of multiple different views that you can use to create, edit and visualize your strategies. Each view brings a unique point of view and focuses on different aspects of strategy work so that organizations can observe and analyze their strategies in a versatile and agile manner. Additional filters and settings allow precise control over what is visible and the different sharing options enable users to share the information within the organization or even to external stakeholders.
Below, we can seen an example of a company's Strategy-section. The section consists of a stationary settings toolbar on the top of the page and the active strategy view that is produced according to the selected settings. Let's go through the different settings in this toolbar. Let's start by reviewing how the different selections and filters affect the visible material. Then, let's review the different available strategy perspectives to better understand their differences and strengths. Lastly, let's check what the actions-menu has in store.
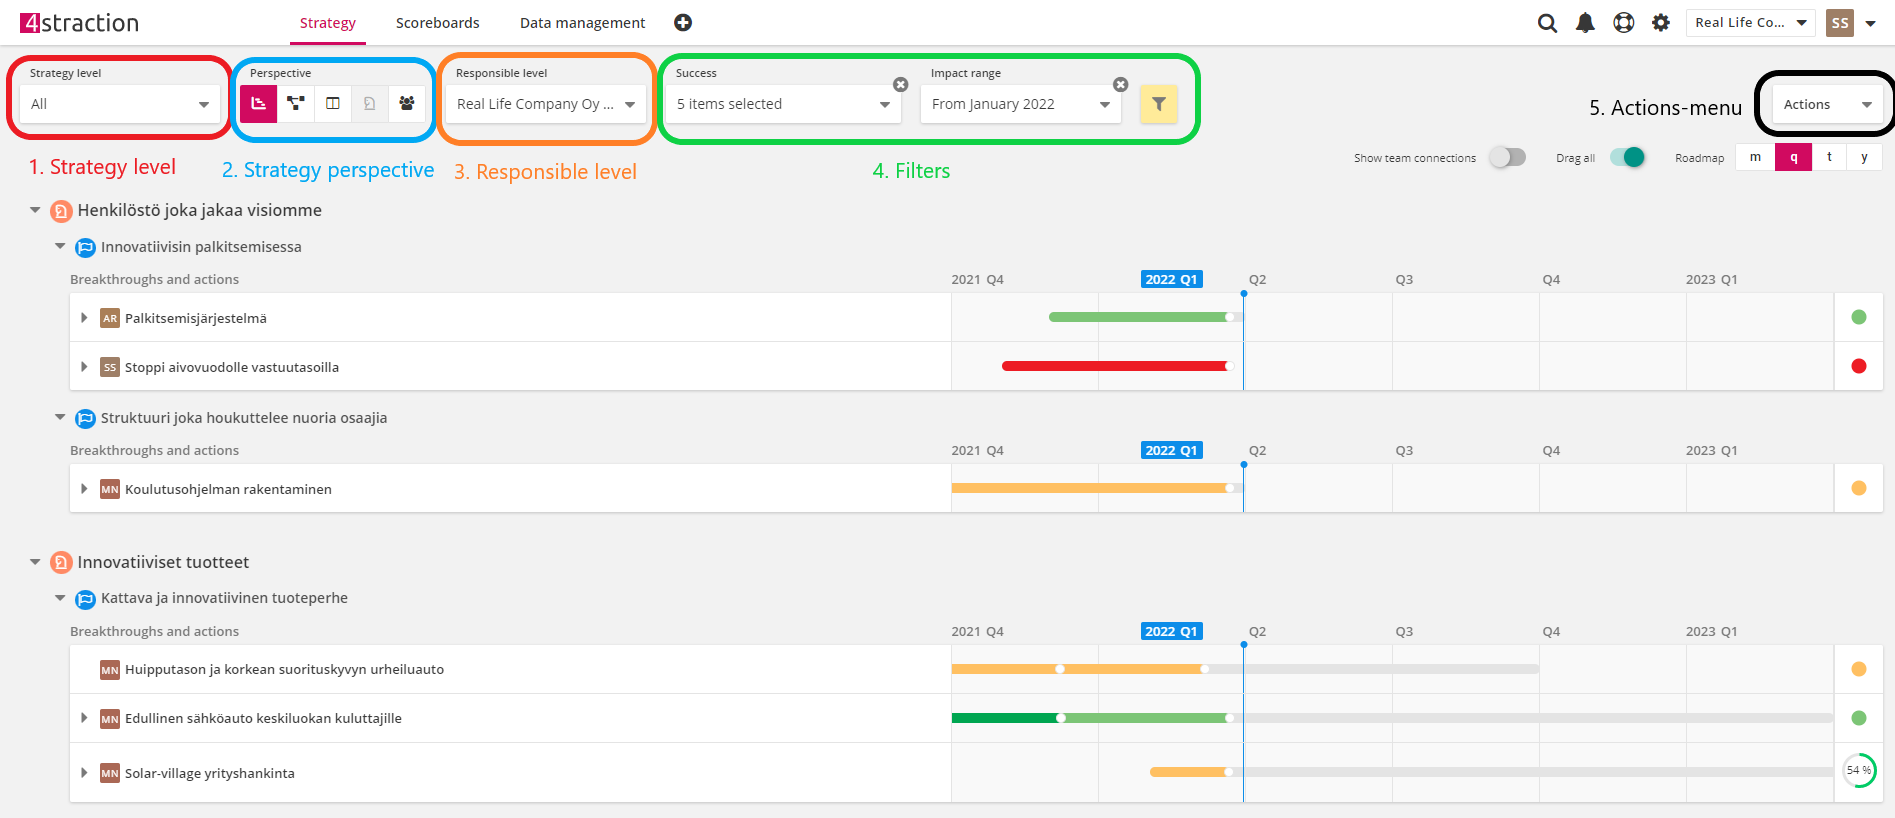
Users can select from two different levels that are used to observe and visualize their strategies: strategy level or responsible level.
Strategy level selection
Strategy level selection lists organization's every strategy and users can select one or multiple strategies to filter the strategy view. Strategy levels are activated by selecting them from the menu and deactivated by selecting an active strategy. Note that selecting a top-level strategy will activate all of its sub-strategies. By default, selection "All" is active showing all strategies and content that match the other set filters.

Saved views
Saved views are a way for users to save preferred visualizations of strategies, so that they are easily accessible later on. To save a strategy view, users need to simply select a strategy perspective, set the preferred filters and settings for it and select "+ Add new view". Non-facilitators can only save strategy views for their personal use, but facilitators have the option to save strategy views for the entire organization. By saving a strategy view for the organization, facilitators can ensure that every user has easy access to certain standardized strategy views which improves accessibility and accuracy of strategy work.
Saved views are stored under the strategy level selection.

Responsible level selection
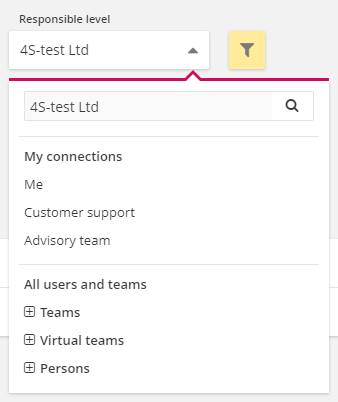
Instead of using certain strategy levels, users can opt to use responsible teams and persons to filter the strategy views. The first options offered are user-specific to make it easier to find the most relevant perspectives; users can select themselves or the teams and virtual teams they are assigned to in the organization chart. For example, in this case the user belongs to team "Customer support" and virtual team "Advisory team". Alternatively, users can select any other team/virtual team or user by selecting them from the section below or by using the search bar at the top. By default, the whole organization is selected in the responsible level selection.
Filters
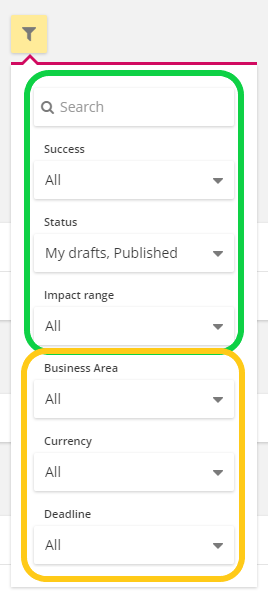
The filters give users additional flexibility to further narrow down what is shown in the strategy view. The available filters consist of four basic filters (marked in green in the picture below) and the additional field filters (marked in orange in the picture below.
The basic filters are following:
- Search-function allows users to search terms or other pieces of text from the strategy pieces' titles
- Success allows users to limit the shown strategies based on the success of its breakthroughs, actions or both of them. In this filter, they can select one or several color-coded success types to be shown in the view.
- Status allows users to limit the shown strategies based on their statuses: "my drafts", "others drafts", "published" or "archived". By default, "my drafts" and "published" are active in this filter.
- Impact range allows users to define a time period and only strategies and strategy parts that have impact range matching the set criteria are shown. They can set an open-ended period by defining a start or end period or a closed period by defining both start and end period.
The additional field-based filters are only offered if the organization has created additional fields in Strategy settings*. Additional fields that have "list of selectable predefined values" can have one or multiple values selected and additional fields that have "date" allow users to define a time period similar to impact range. For example, our example company has created three additional fields "Business Area", "Currency" and "Deadline" which they can use to filter their strategy views.
*For more information about additional fields and Strategy settings, see article Strategy settings
Once filters are activated from this menu, they become visible in the toolbar area to clearly indicate that they are active. Once active, filters can be easily removed by clicking on the X:

Different strategy perspectives
4straction offers multiple ways to visualize your strategies to enable different approaches to strategy work. Each strategy perspective type offers a unique point of view and has its own functionalities. Currently, 4straction offers five types of different strategy perspectives:
- Roadmap
- Strategy map
- Board
- Description
- Organization structure
These perspectives are described more in detail in independent sections below. Each of the examples are formed from the same strategy "Henkilöstö joka jakaa visiomme" with the same filters, so that their different approaches and qualities are displayed more clearly.
Roadmap
The roadmap offers organizations a way to visualize the progress of their strategies by showing the breakthroughs on a joint timeline. The breakthroughs are divided into groups based on the strategy and strategic goal they belong to. Actions can also be shown in the roadmap by opening them with the arrow next to the breakthrough's name.
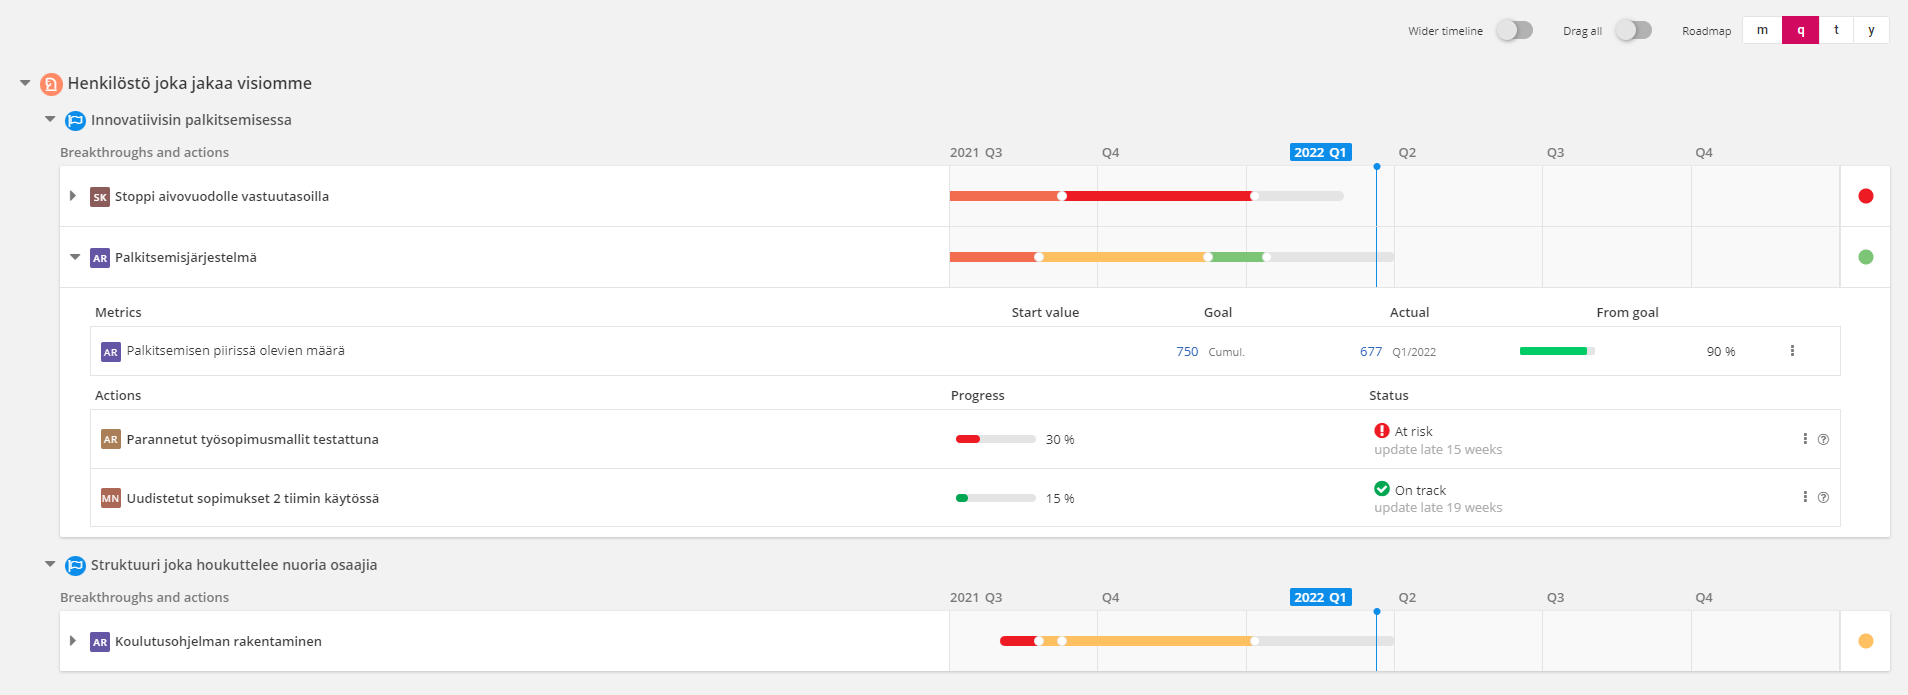
The visible timeline can be moved by dragging it which enables the observation of past or future time periods and the visible content is adjusted accordingly. Timeline settings (wider timeline, drag all timelines and timeline interval) can be found in the top right corner.
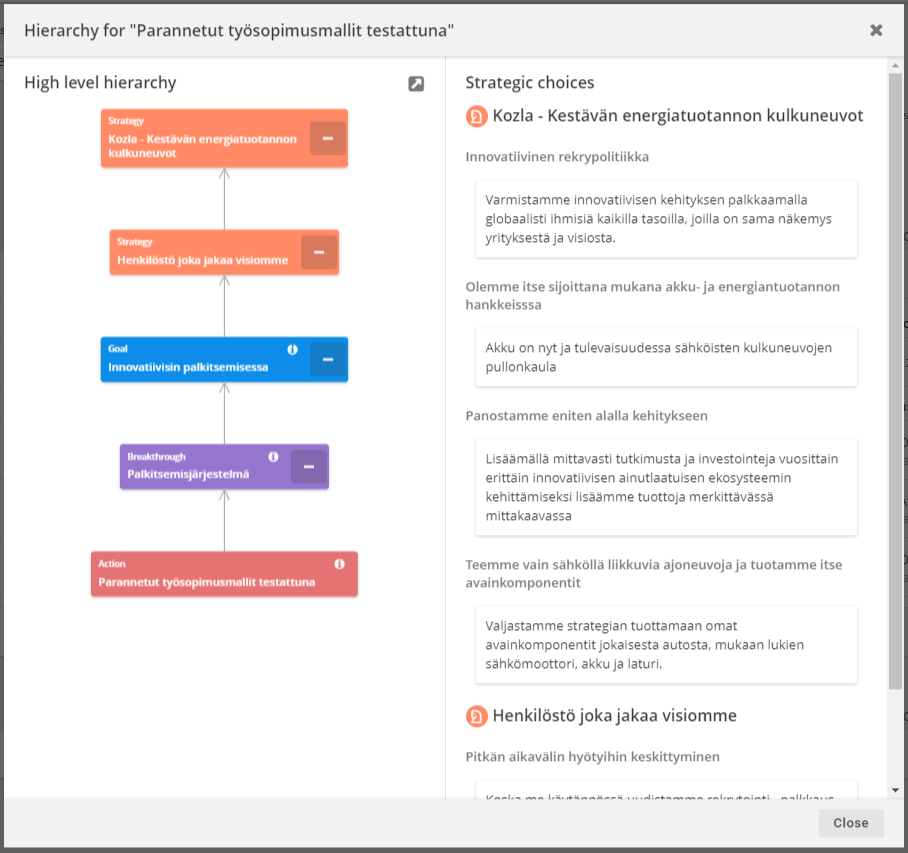
Besides offering a useful way of visualizing your strategy, roadmap also allows users the variety of options to edit their strategies. By clicking the name of a breakthrough or action, they can open its page where they can make changes to its settings and linked metrics. There is also a separate actions-menu for each breakthrough and action that can be opened from the three dots that show up, when you hover over the item. The question mark opens up a separate simplified view that visualizes the strategic structures that the breakthrough/action belongs to.
Strategy map
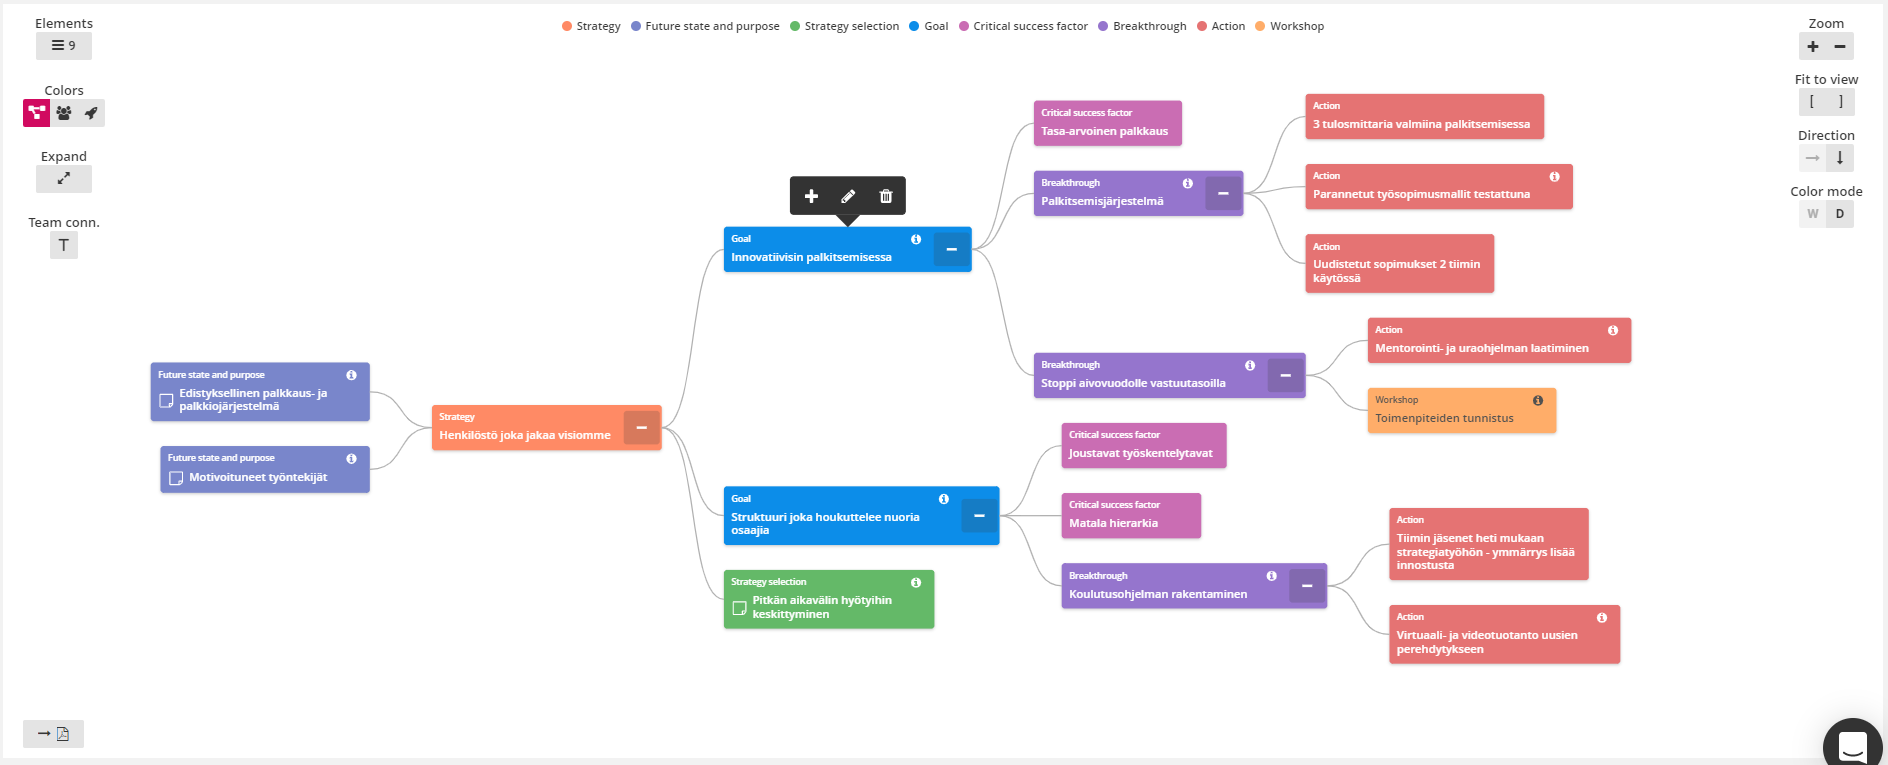
The strategy map offers organizations a way to visualize all of their strategic structures and strategy parts in a customizable mindmap form. The strategy map also possesses some nice interactivite qualities: users can open and close objects in the mindmap by using the plus- and minus-buttons which allows them to control how detailed the mindmap is.
The strategy map has settings on both side of the map: the left side dictates the content of the map and the right side the visual aspects of the map. On the left side of the strategy map, users can select which strategy parts are visible by opening the Elements-menu. The Colors-setting defines how the items are colored in the map: "Based on content" (active by default) color codes each strategy part based on its type, "Based on team" color codes strategy parts based on what team they are assigned to and "Based on success" color codes strategy parts based on their success rates (similar to roadmap). Users can also expand all strategy parts visible and illustrate the team connections from the left side. The right side offers manual zoom buttons, fit to view-function, direction selection and color mode selection.
Besides offering a visualization of the strategy, strategy map also offers a chance to add, edit and delete strategy parts. By hovering over a strategy part, a toolbar shows up which can be used to add new strategy parts (plus-icon), edit the strategy part (pen-icon) or delete the strategy part (trash can-icon). In addition, breakthroughs and actions can be transferred to different strategy parts by dragging them to the part. Similar to roadmap, users can also click on the breakthroughs and actions to open their pages. The strategy map can also be exported in pdf-format from the bottom left corner.
Board
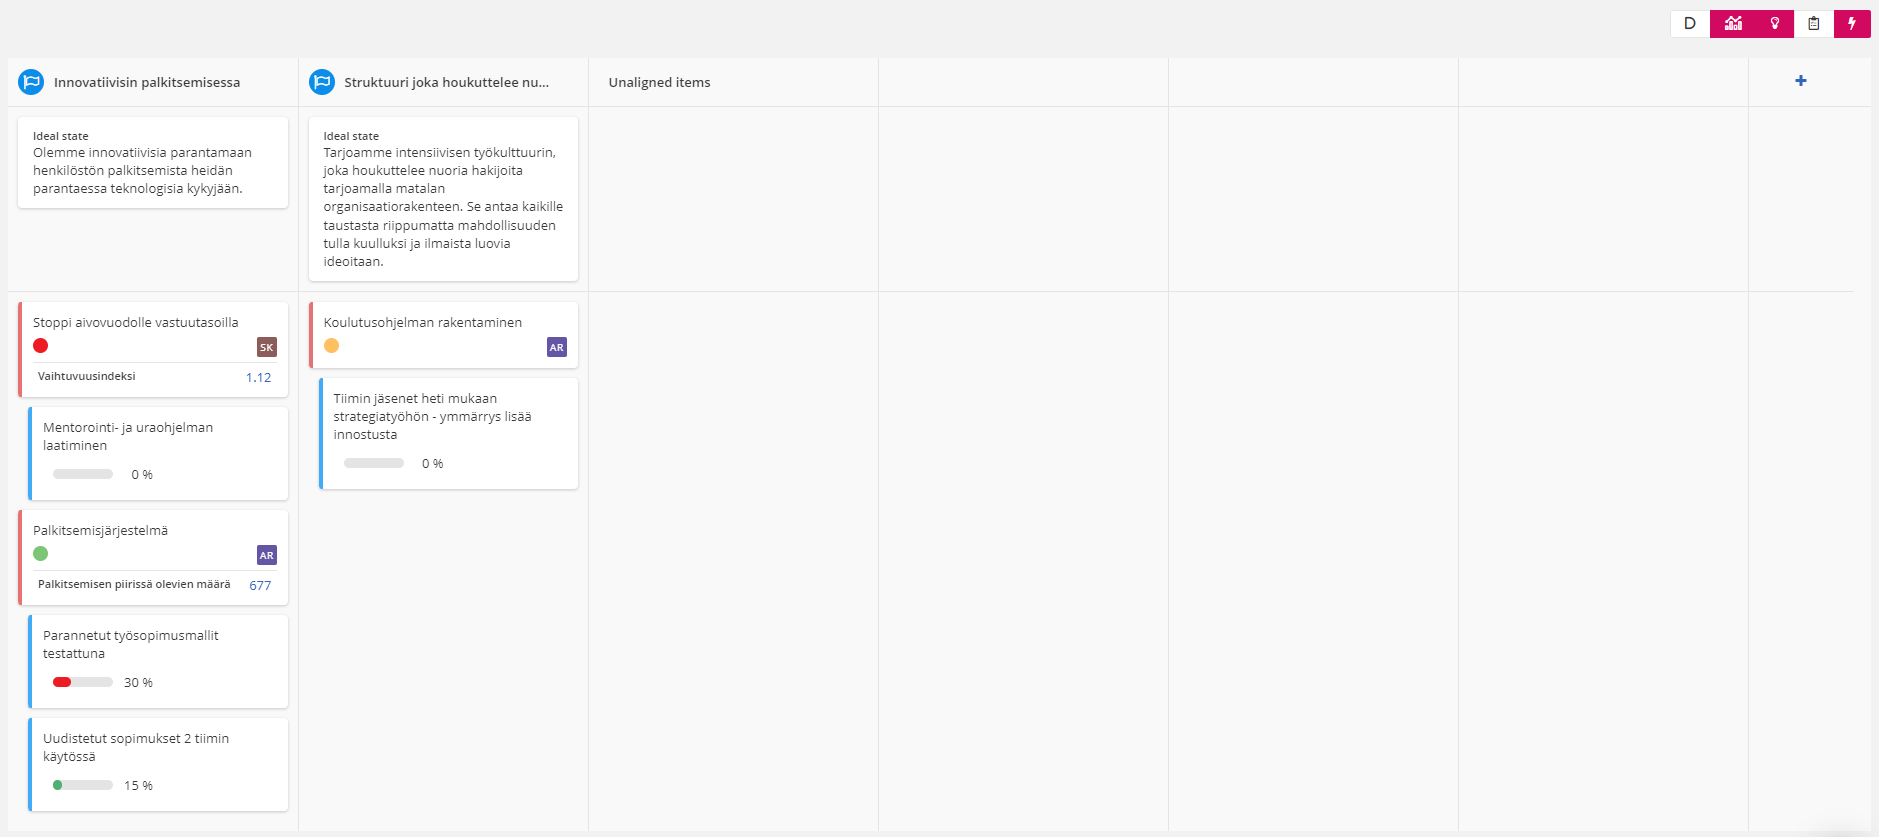
The board view shows each strategic goal as its own lane in a board and lists the breakthroughs (and actions, if toggled on) under them showing their current status. The top right corner contains additional settings that control the shown information:
- are unaligned breakthroughs and actions shown in a separate lane
- are metrics shown
- are descriptions shown for strategic goals
- are critical success factors shown for strategic goals
- are actions shown
Besides offering a visualization of the strategy, board view can also be used to edit the strategy in several ways. Users can drag and drop breakthroughs to different strategic goals and actions to different breakthroughs. Breakthroughs can also be re-organized to preferred order by dragging and dropping them which affects their order also in every other strategy view. This feature becomes especially handy with the unaligned items as users can just drag them to a new location to quickly incorporate them as part of their current strategies. Users can also add new strategic goals with the +-icon, and edit the existing ones or add new breakthroughs from the menu next to strategic goal's name. In addition, clicking on an action or a breakthrough will take the user to its page, where they can do more comprehensive editing.
Description
The strategy description shows the basic information and structure of a strategy in a balanced scorecard form. The strategy is divided to sections based on the strategic goals and the breakthroughs are listed under them showing their current status and expected duration. The top of the description shows basic information of the strategy and the top right corner the status of the strategy. Descriptions of "future state and purpose" and "strategic selections" for the strategy are listed on the right. The critical success factors and ideal state of strategic goals are also visible. Any dashboards connected to the strategy are shown at the bottom of the description and the metrics connected to strategic goals and breakthroughs can be shown by clicking the chart icon.
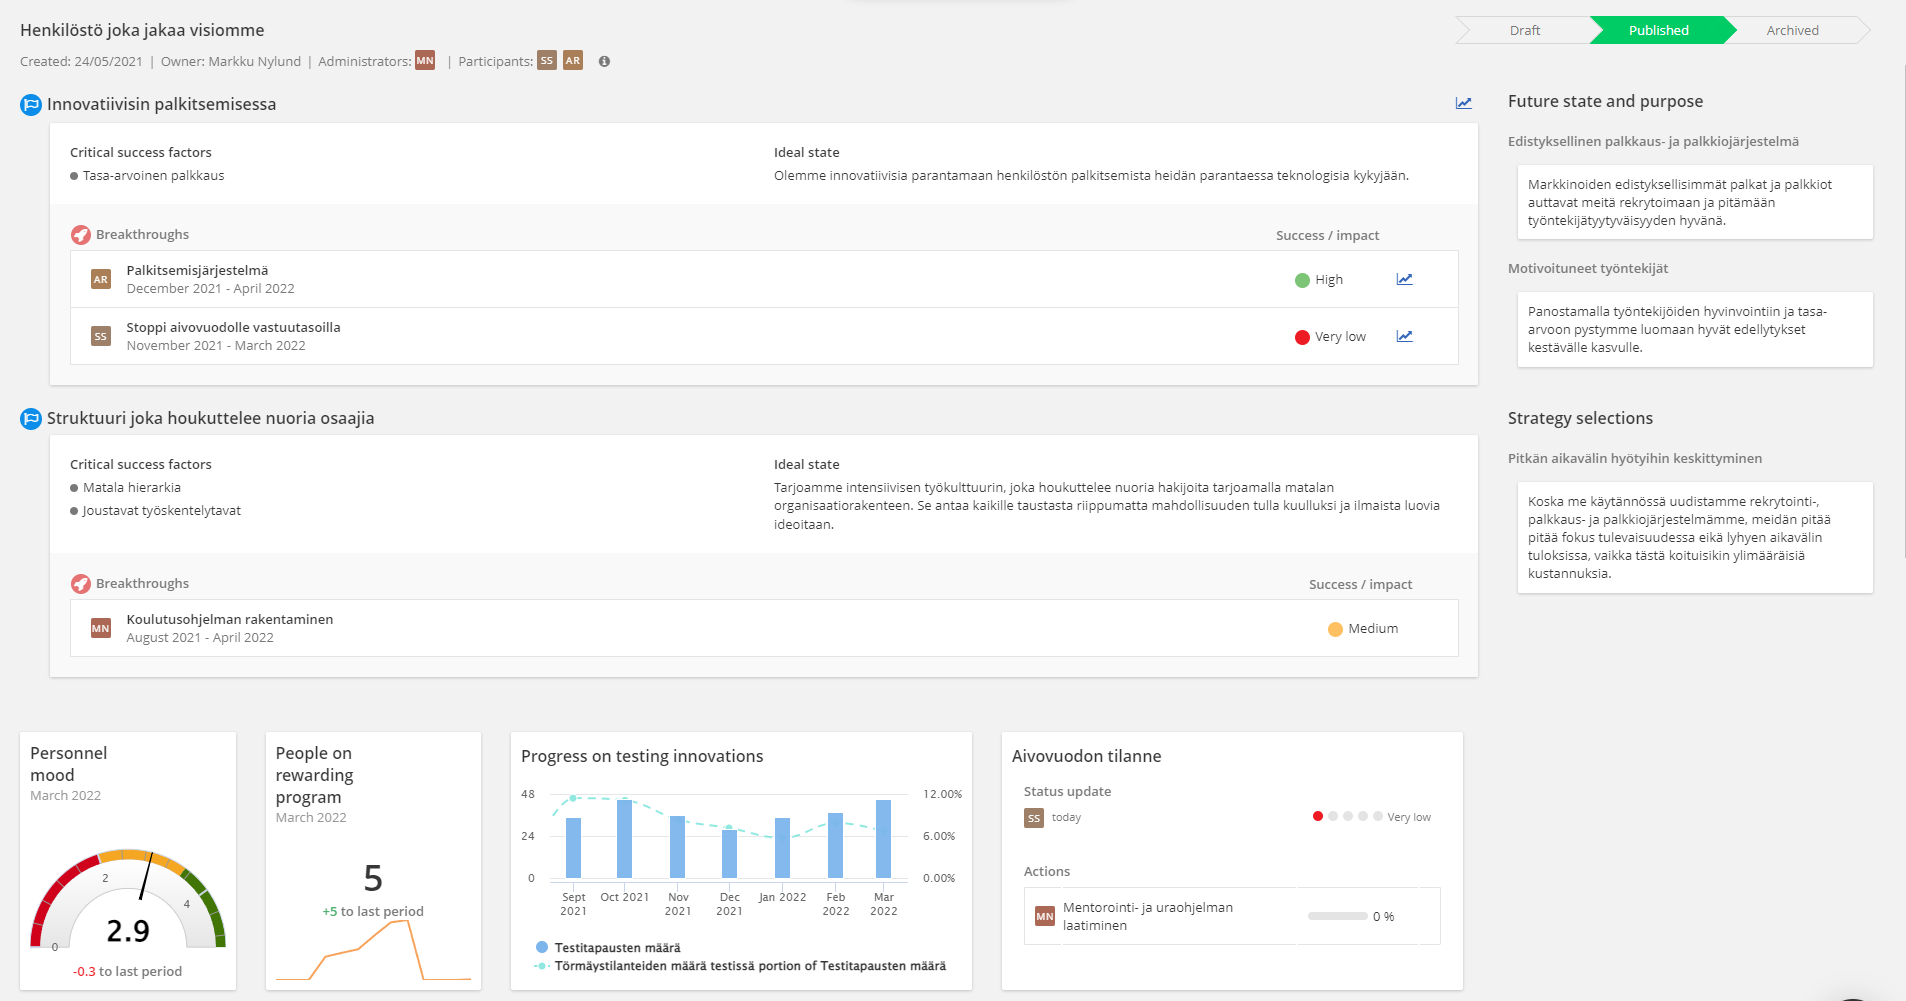
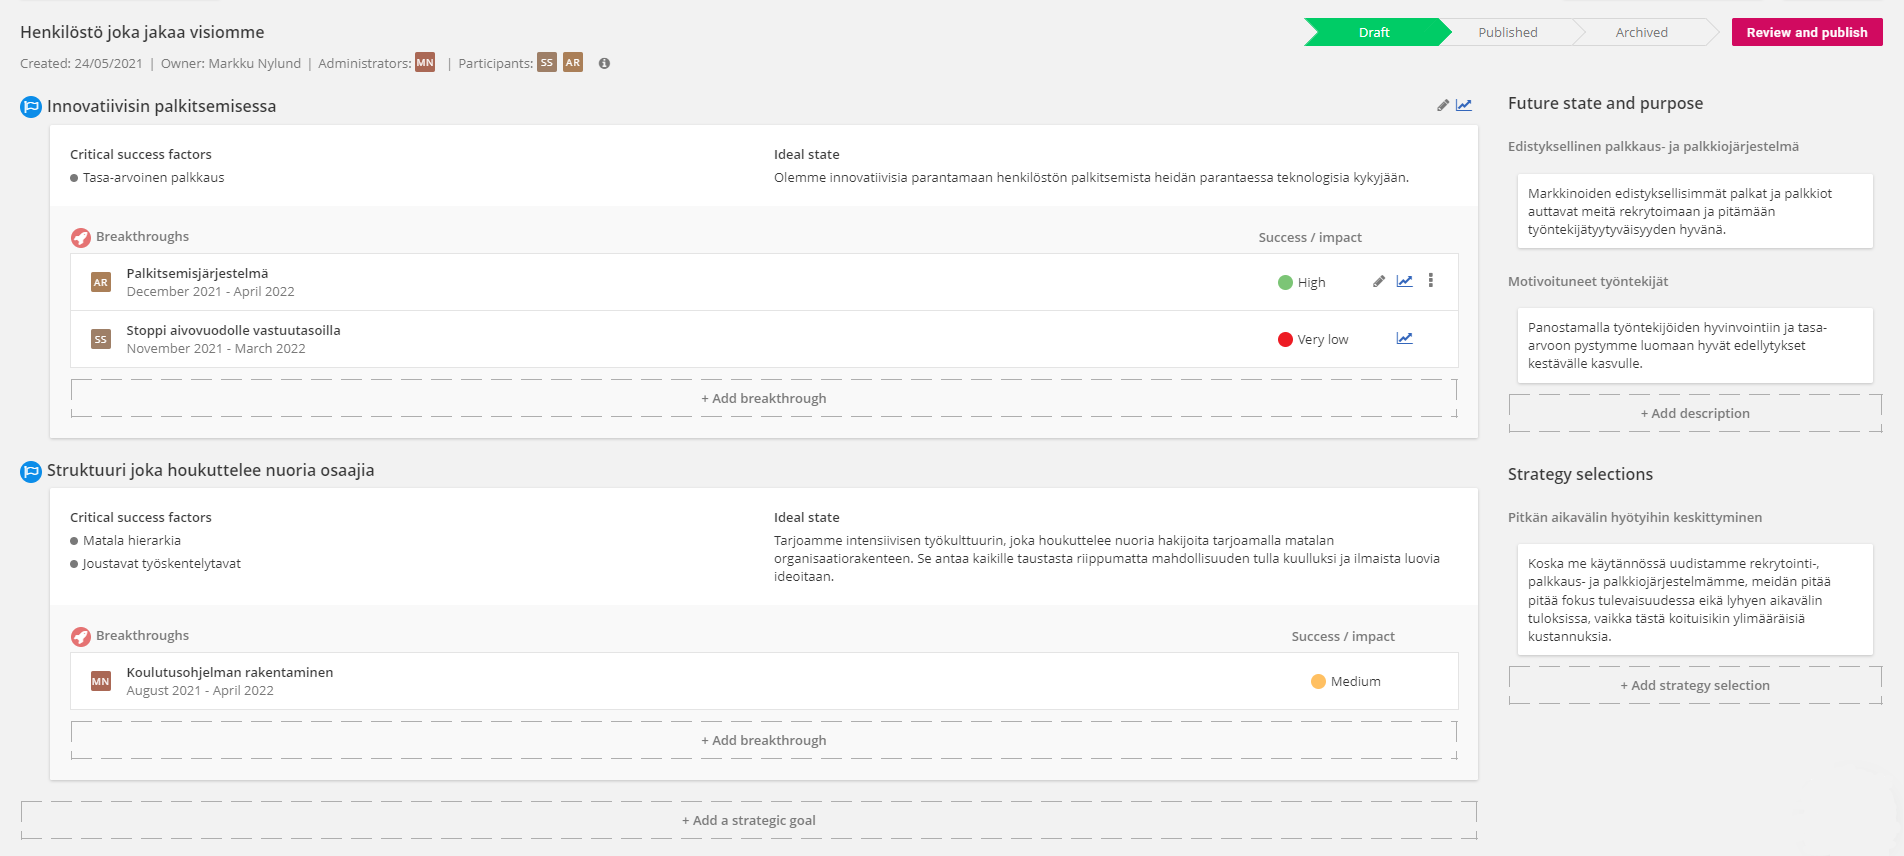
The appearance and available functionalities of the description view depend on whether the strategy is published or still a draft. When the strategy is published, the description acts mostly as an overview of the strategy (as seen above), but when the strategy is in draft mode, the description page can be used to freely add and edit the existing strategy parts.
Organization structure
Organization structure view shows the strategy against the created organization chart based on the responsible users and teams. It allows organizations to quickly see which teams are responsible for the progress of different areas of the strategy. Similar to the strategy map, the left side contains settings affecting the content and the right side contains settings affecting the visual elements. Besides having the opportunity to select the coloring of strategy parts (based on content, team or success) and if team connections are visible from the left, users can also select if actions or teams without breakthroughs/actions are visible. The right side settings are identical to strategy map: manual zoom buttons, fit to view-function, direction selection and color mode selection.
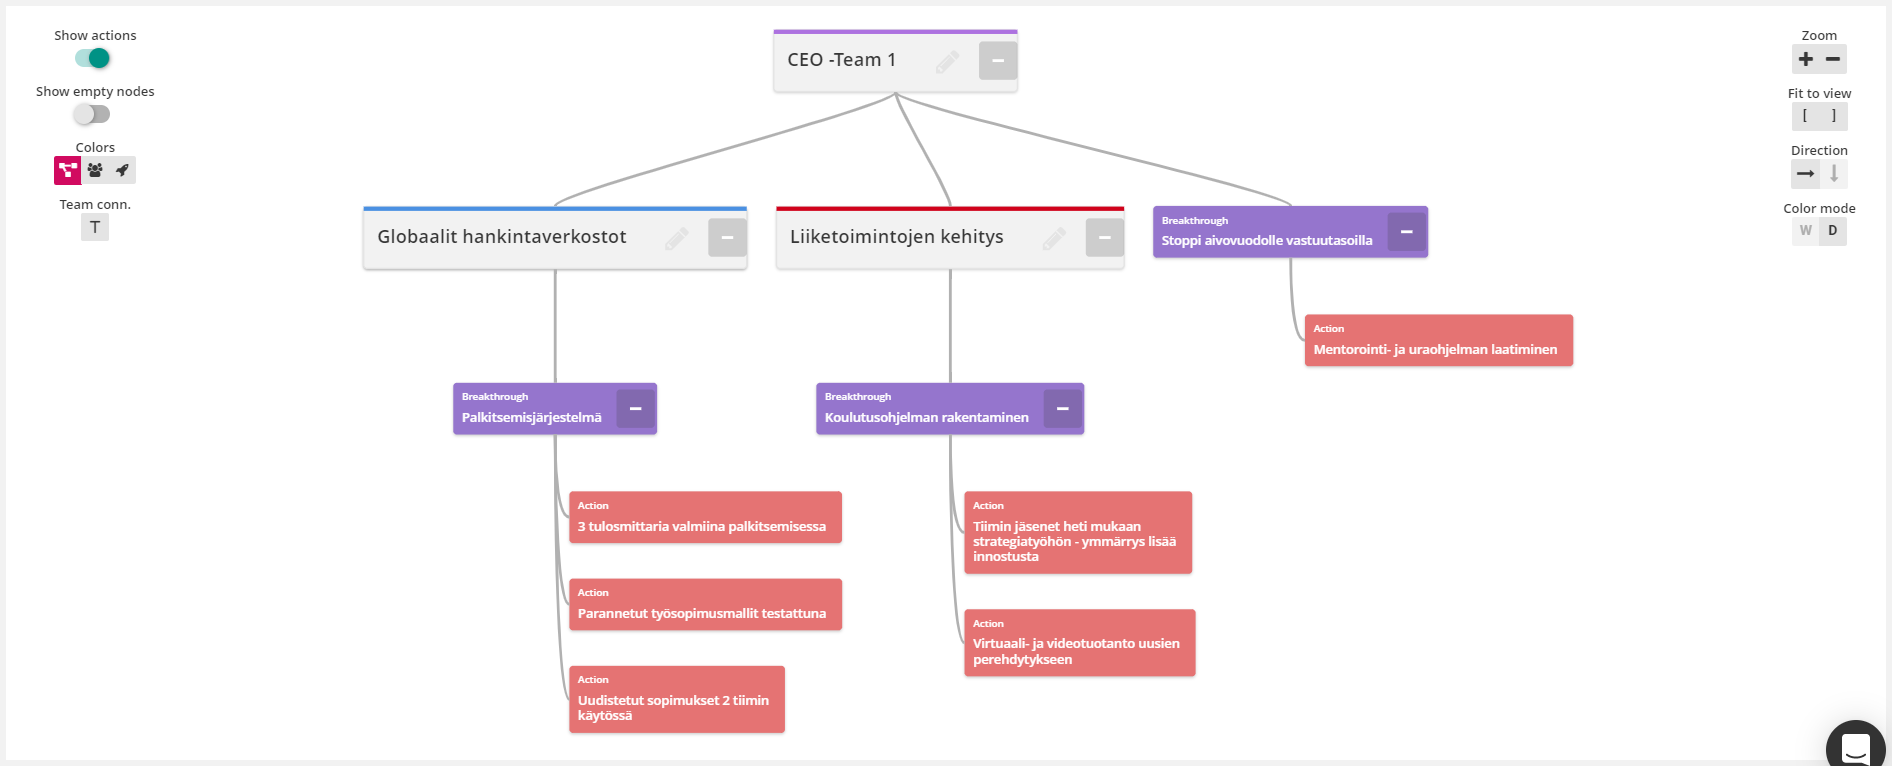
The organization structure also allows users to quickly change the responsible teams by dragging and dropping breakthroughs and actions on top of another team. Similar to the actual organization chart in general settings, users can also define the team colors in this view by using the pen icon on each team which affects all team-based visualizations of strategy. Clicking on a team also opens the team page which lists all the breakthroughs that the team is responsible for and all the team members:

Linked dashboard page
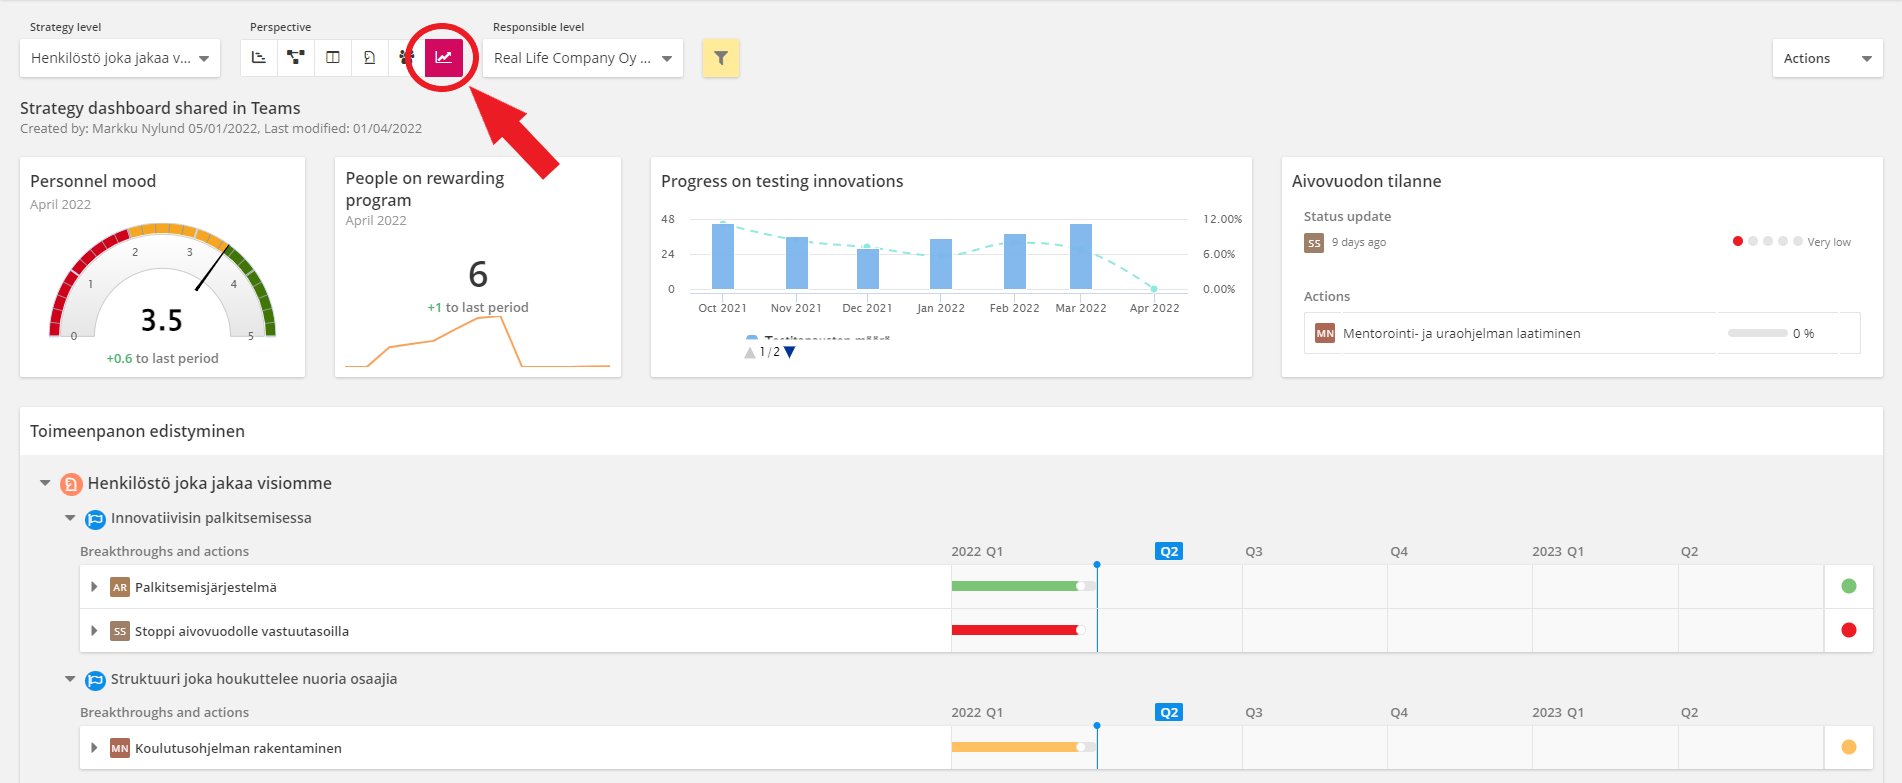
In addition to these five perspectives, a sixth option is offered in the strip if the strategy has a dashboard linked to it. This perspective conveniently shows the entire linked dashboard, so that users don't have to separately navigate to Scoreboards-section if they want to see it:
Actions-menu
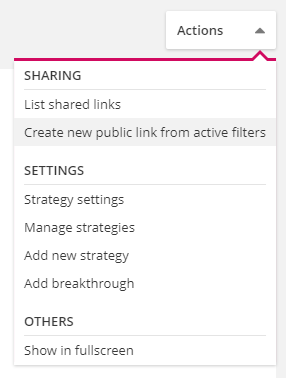
The actions-menu is always located in the top right corner of Strategy-section. It contains general settings regarding the Strategy-section and it is mainly intended for facilitator use. Facilitators can use it to edit the general strategy settings, manage created strategies and add new strategies and breakthroughs. It also contains the sharing options, also known as public links. You can read more about public links and their settings in article Julkiset linkit
Fullscreen mode can also be activated from this menu which eliminates the toolbar from the top of the page. Actions-menu also contains two perspective-dependant selections. In roadmap facilitators can select "Export report to dashboard" to generate a resizable dashboard block to Scoreboards. In description facilitators can select "Edit strategy without going to planning phase" to activate the editing mode without officially changing the strategy's status.
