

Metrics are a simple, yet effective way of incorporating easily understandable data to your strategies and their different parts. They show the progress of indicators against chosen goal values in a visual format which allows users to quickly see whether KPIs related to different parts of the strategy are progressing or not.
Metrics on different strategy levels
Metrics can be added to all of the service's strategy levels. They allow the users to easily track progress of relevant data related to each strategy part. The number of possible metrics depend on the strategy level: Strategies, Strategic goals and Breakthroughs can contain several metrics, but Actions can contain only one as they are the only part that can have their progress measured entirely based on the metric.
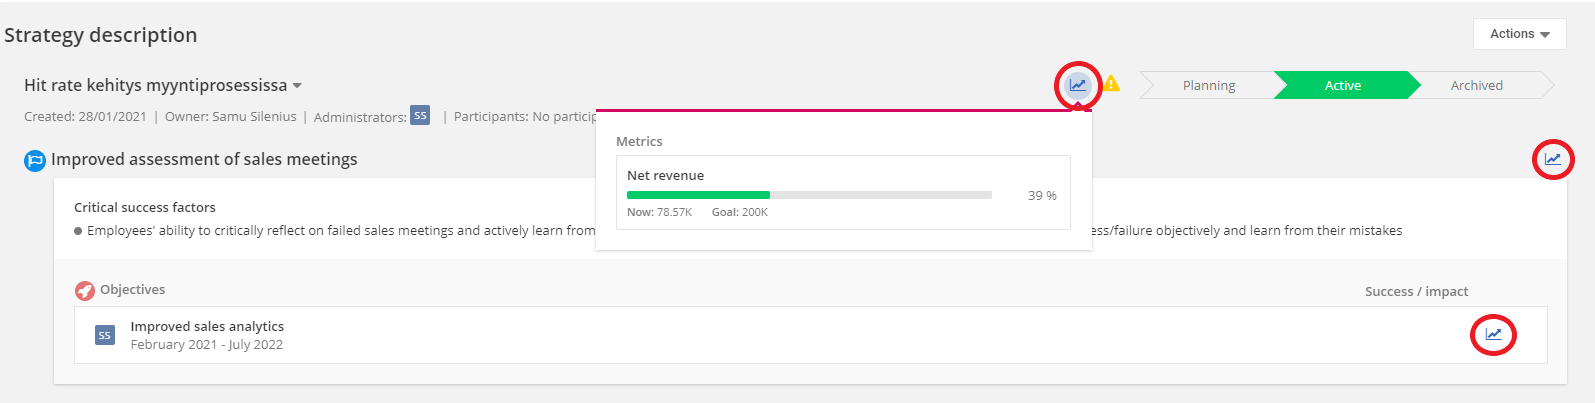
When a metric is added to a strategy part, they can be accessed from several sections of the Strategy module. In Strategy Description, metrics can be shown by clicking the chart-icon on each strategy part:
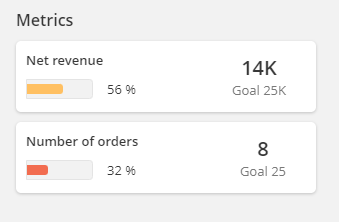
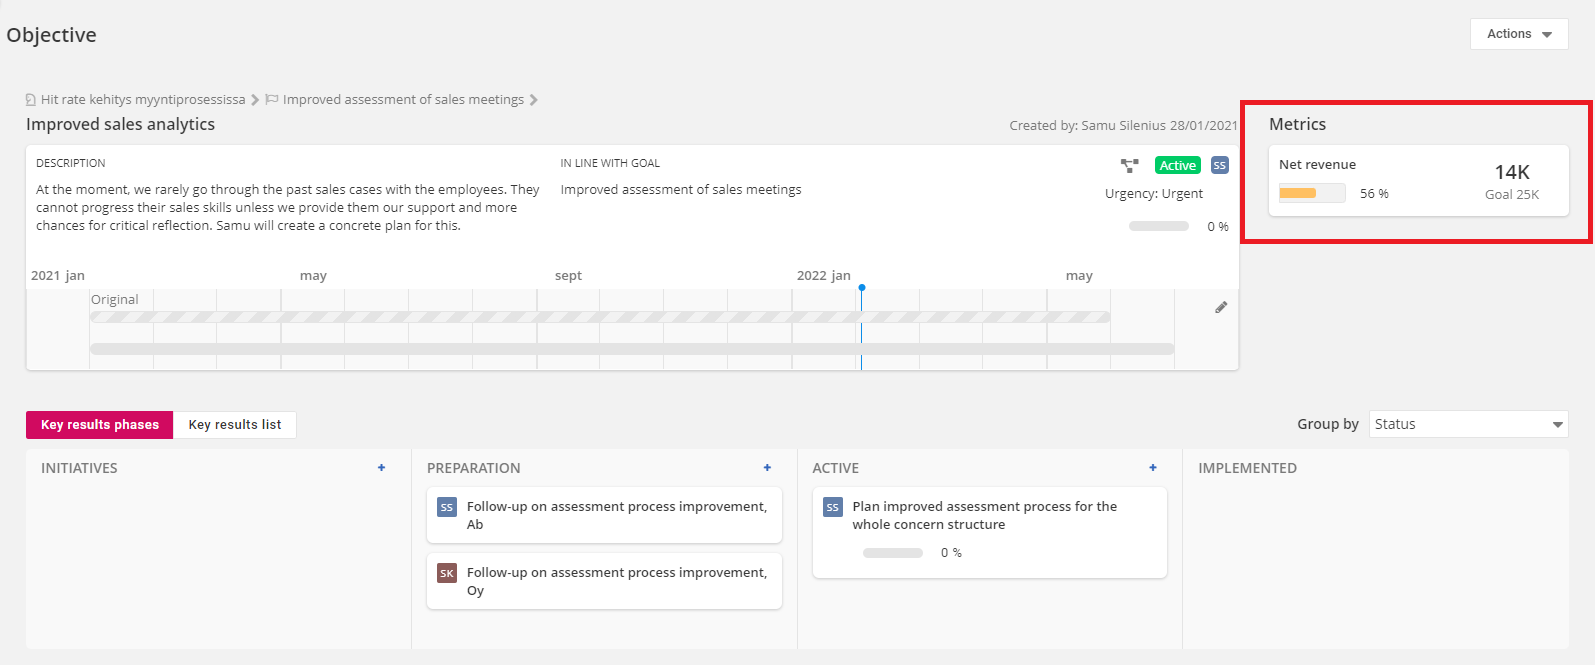
On a Breakthrough's page, the metrics are listed on the right side of the page and the progress of Actions' metrics are also visible on the bottom:
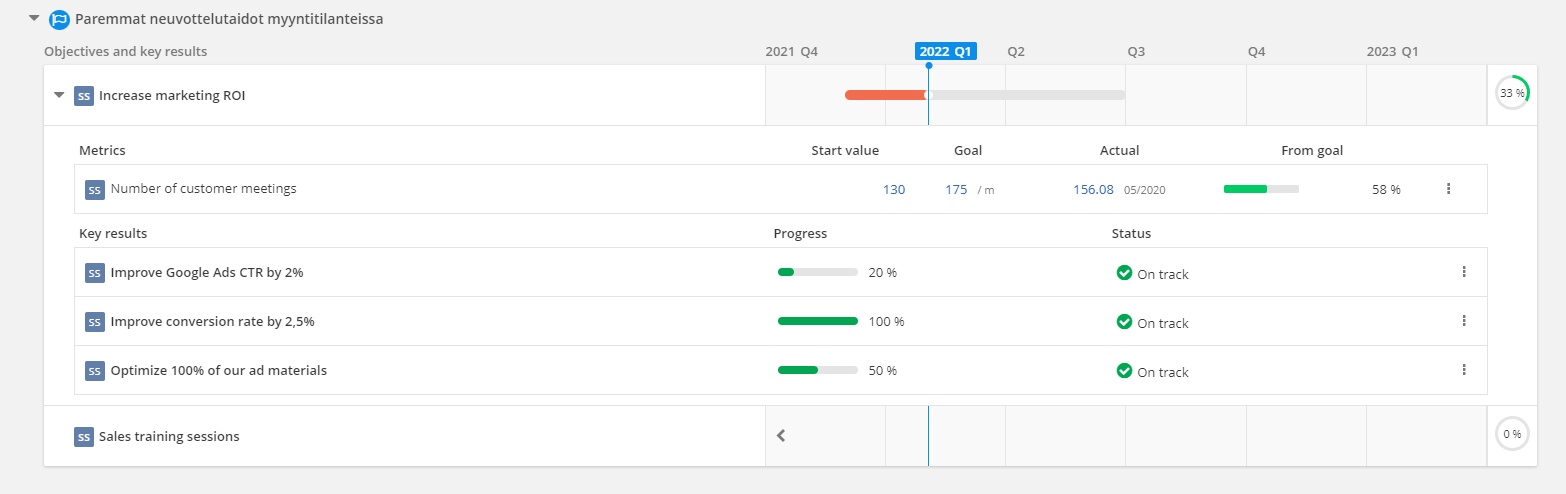
Metrics for Breakthroughs and Actions can be opened in the Action plan by clicking the arrow next to the Breakthrough's name which gives a good overview of the situation:
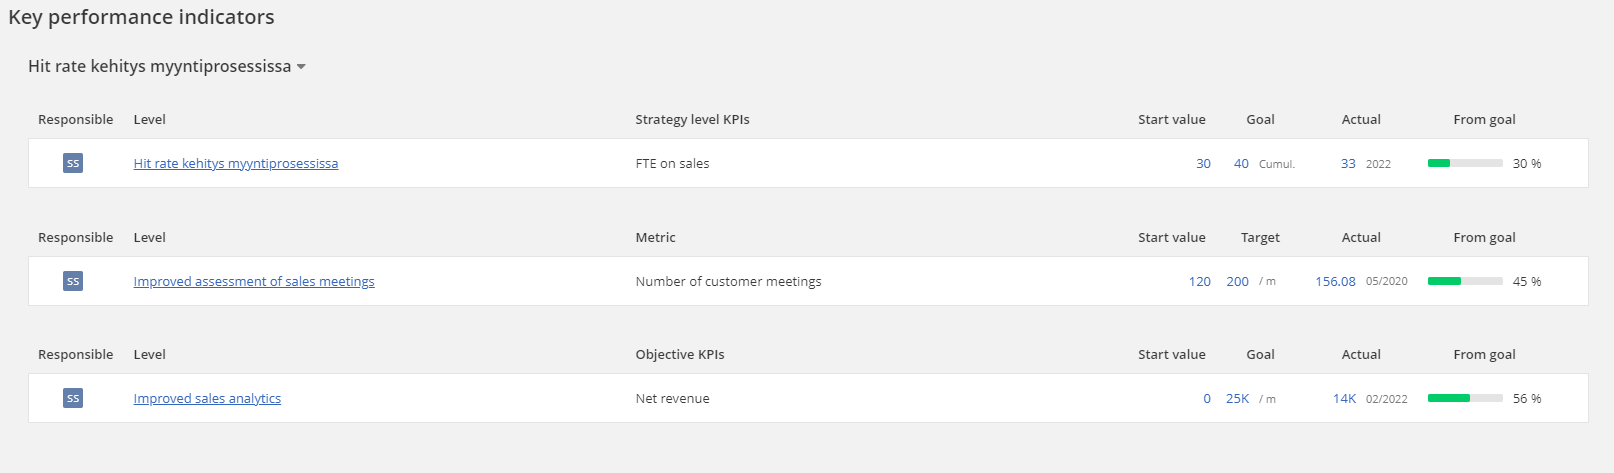
There is also a separate section, Key Performance Indicators, that lists all the metrics linked to Strategies, Strategic goals and Breakthroughs:
Adding metrics and metric calculation logic
Adding a metric
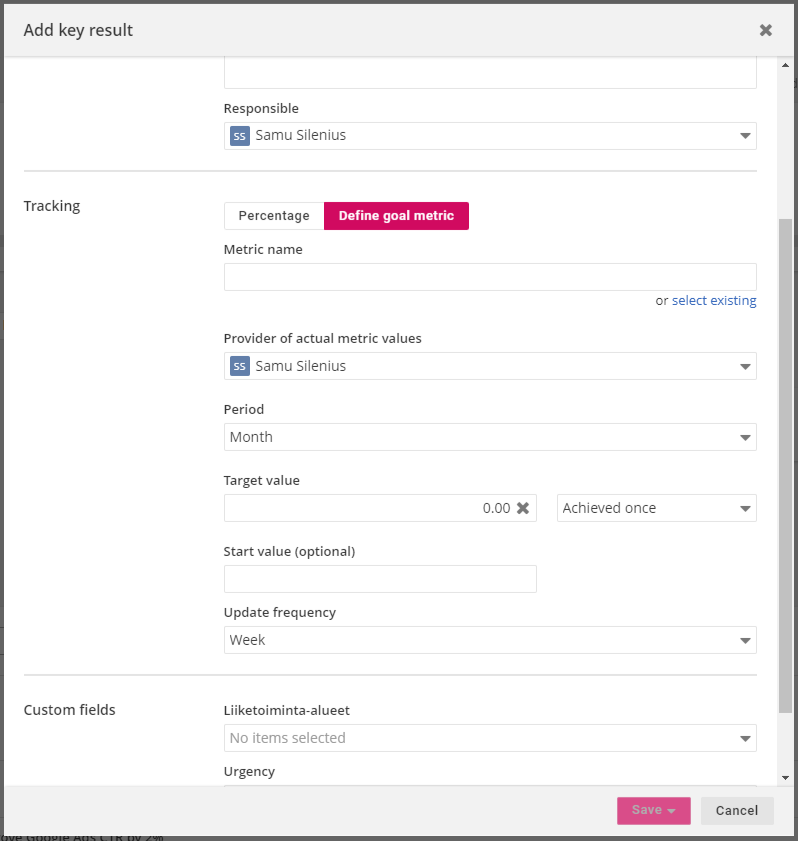
Metrics can be added to Strategic goals and Breakthroughs from their respective pages. Strategic goals have their metrics in their settings, while Breakthrough metrics can be added/edited from "Edit metrics" that is in the page's Actions-menu. Metrics for Actions can be set up in the tracking section by choosing "Define goal metric". Each metric has the same settings that can be seen below:
As the metrics are based on indicators, the user can choose to use an existing indicator or create a new one. If user decides to use an existing indicator, they can use available filters for the indicator values. After selecting an indicator for the metric, a provider of actual values must be selected. This can be someone else than the responsible user of strategy part.
Metric calculation logic
Selecting an indicator affects how the actuals are updated for the metric. How the the metric's progress is calculated depends on the other settings: period, target value and start value. Period for the metric can be selected from the selection of supported period types (day, week, month, quarter and year). The target value of the metric consists of two separate options: the actual target value and its achievement logic. The target value is a simple value input, e.g. 500,000 of sales or 5(%) of growth. The achievement logic dictates how the progress towards the target value is calculated. There are 3 options for this:
- Achieved once, where the actual values are accumulated from all possible periods to measure whether the target is achieved. E.g. an organization could have a target of achieving 50 new clients in total and they want to track the total progress of this.
- Achieved on each period, where the actual values are calculated for each selected period type and then compared to the target value (that is same for each period). E.g. an organization could have a target of having 20 sales meetings each month with potential clients and they want to achieve this target every month.
- I will set the goal values myself, where the actual values are calculated for each selected period and then compared to each period's own target value. This allows the organization to set the target values for each month flexibly and have different values for each period. E.g. an organization could have a unique sales target for each month based on data from separate forecast model and they want to track the progress of achieving these targets. Note: This option retrieves the target data from the indicator's "Goal" dimension, so the values need to be inserted separately for each period.
In addition to the target value, the user can optionally set up a start value which affects how the progress is calculated. E.g. if the user sets their target value as 100, start value as 20 and the last actual is 30, the progress is calculated based on progress from 20 to 100: (30-20)/(100-20)= ~13% (rounded from 12,5%). This allows the user to measure progress on metrics that have already had progress that should not be included in the calculations. In the case of existing indicators, the start value is filled automatically based on the chosen period and achievement logic. In the case of existing indicators, the user is also offered an additional option "Update action initial value from actuals" which allows them to automatically use the current actual value in status updates thus eliminating the need to manully input the value. As the last option, the user can define the update frequency that affects how frequently the "provider of actual metric values" is reminded. The options are weekly, biweekly, monthly, quarterly, yearly and no scheduled update.
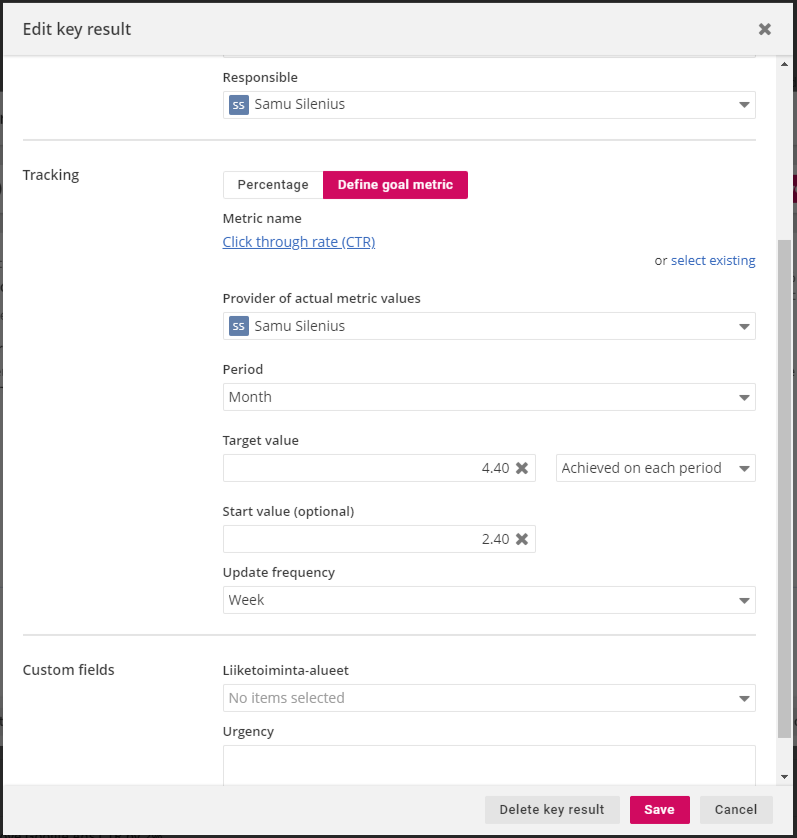
Below we can see the metric settings for one of our example companies. Their Key Result is to achieve a CTR of 4,4(%) which is set up as the target value. An existing indicator "Click through rate (CTR)" was selected for the metric as it receives its data automatically from Google Analytics. The start value 2,4 was implemented as they are interested in the progress from current 2,4 towards their target 4,4. Also, as they are interested in achieving permanent effect, they have set achievement logic as "achieved on each period".
Status updates for Actions/Key Results with metrics
If a metric is set up for an Action/Key Result, its progress is measured based on the metric's settings. However, separate status updates are still needed as they contain vital information in the form of brief comments and status evaluation. These status update requests are sent to the user designated as the "provider of actual metric values" in the settings.
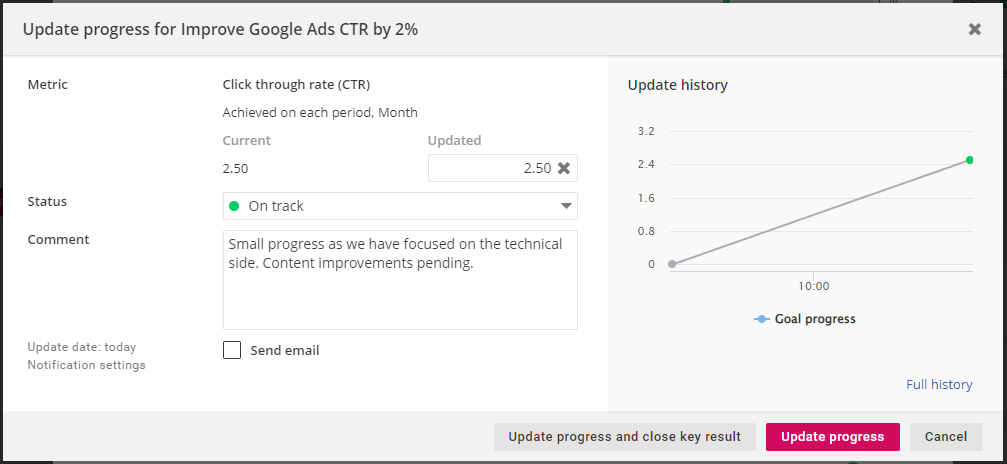
While doing a status update for an Action/Key Result with a metric, the user inserts the current actual value for the metric and thus confirms its validity. In the case of metrics with indicators receiving their actuals from a data source, the actual value is automatically updated according to the current value. The date of the status update can be changed from the choice "Update date:" in the bottom left corner. This is automatically set as "today", but the user can select any past date which allows them to do status updates retrospectively. In addition, the user can select a status (On track, Has issues, At risk) which is shown colored in the timeline or add a short comment that's visible with the status update and stored in the log. Lastly, other users can be notified of the status update by activating "send email" and selecting recipients from "notification settings" on the left.
After all the information is inserted, status update can be completed by selecting "update progress". If the Key Result is completed after the status update and the user wants to close it, they can select "Update progress and close key result".
Actuals of financial data cannot be altered in status updates.
Examples of setting different metrics
This section contains a few examples of how different metrics can be set up for strategy parts. As mentioned in the earlier section, metrics have the same settings in each strategy part, so these examples are applicable in any of the strategy parts.
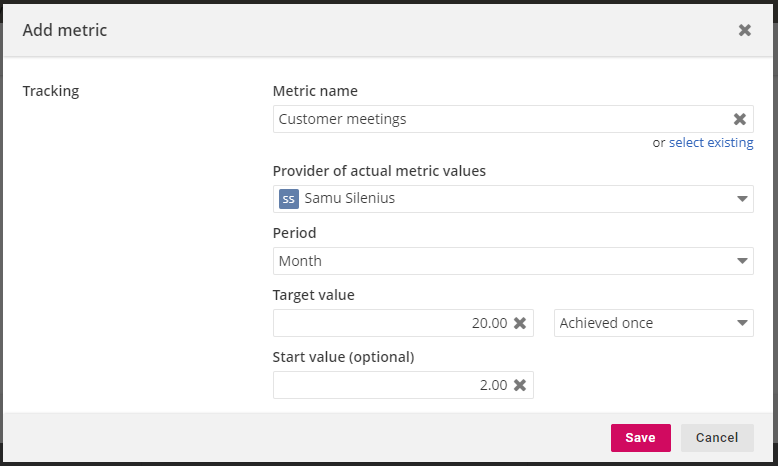
Example 1: Tracking customer meetings, goal: 20 altogether
In this example, a company wants to measure the progress of their Customer Success team's strategy by adding a metric to their breakthrough. This metric shows how many customer meetings they have had altogether and their total goal is to achieve 20 customer meetings.
They can set up the metric with following settings.
- For indicator, they can select an existing indicator (if they would receive the data from e.g. a CRM system) or create a new one, if the data does not exist in the system yet.
- The period selection is irrelevant in this case, as they are measuring total accumulated values.
- Target value is set as "20" and achievement logic as "Achieved once", as they measure the progress of total amount of meetings.
- Start value can be inserted, e.g. if there has already been a few meetings that need to be included in the progress calculation.
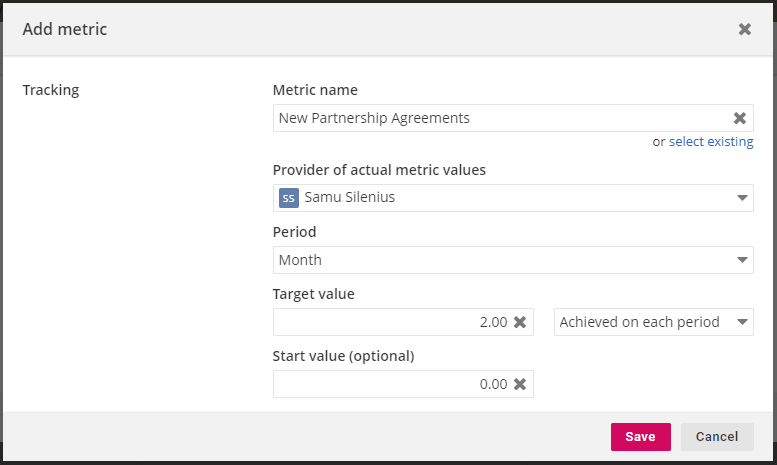
Example 2: Tracking new partnership agreements, goal: 2 each month
In this example, a company wants to measure the achievement of a certain goal for each period. This metric shows how many new partnership agreements they have made each month and their goal is to have two of these agreements every month.
They can set up the metric with following settings:
- For indicator, they can select an existing indicator (if they would receive the data from e.g. a CRM system) or create a new one, if the data does not exist in the system yet.
- Period is set as "Month" as they are measuring monthly data.
- Target value is set as "2" and achievement logic as "Achieved monthly", as they measure the achievement for each month.
- Start value can be inserted, e.g. if there has already been some agreements that need to be included in the progress calculation.
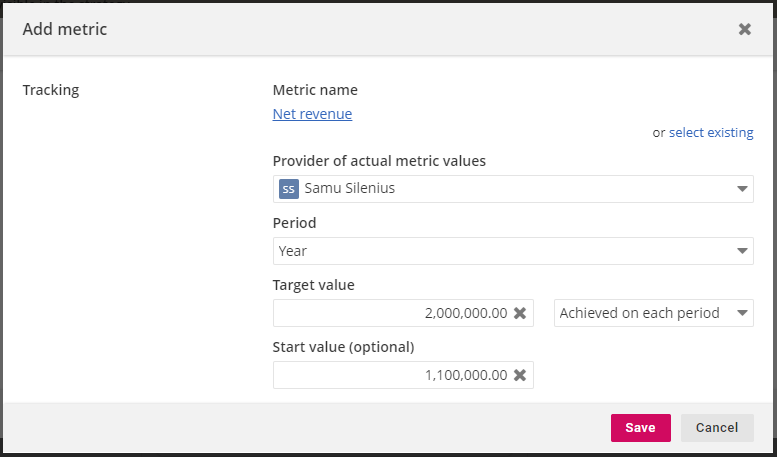
Example 3: Tracking revenue growth during one year with a start value, goal: 2 million €
In this example, a company wants to measure the growth of their yearly revenue with a goal of 2 million €. However, they have already accumulated revenue as they set up the metric in June and want to exclude the currently generated revenue from the progress calculation.
They can set up the metric with following settings:
- For indicator, they'll select "net revenue" as they have a financial system connected to 4straction.
- Period selection is set as "Year" as they measure the progress of yearly values.
- Target value is set as "2,000,000" and achievement logic as "achieved on each period".
- Start value "1,100,000" is imported automatically based on the actuals and they want to use it to correct the progress calculation.
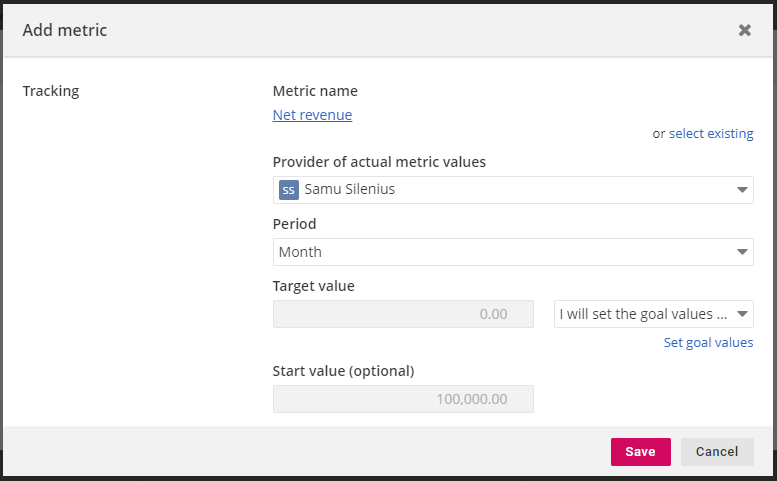
Example 4: Tracking revenue against period-specific goals
In this example, a company has separately set period-specific goals for an existing indicator and they want to use these values to measure the metric's progress. This can happen with financial indicators as they often have seasonal fluctuation in their values and having the same goal for each period is not useful. In this case, they want to track whether their revenue reaches previously set goals each month.
They can set up the metric with following settings:
- For indicator, they'll select "net revenue" as they have a financial system connected to 4straction.
- Period selection is set as "Month" as they measure the progress of monthly values.
- Achievement logic as "I will set the goal values myself" which disables target value field. With this option, the metric will use "goal" dimension values set for indicator "revenue". In this case, these goal values are imported from their separate forecast model. Alternatively, they could insert the monthly goals by clicking the "Set goal values" that appears with this choice.
- Start value is locked according to the actuals for the selected period type.
Example 5: Tracking yearly revenue growth %, goal: 5%
In this example, a company wants to track the achievement of their yearly revenue growth-%. They have a goal of growing their revenue each year by 5%. In contrast to the other examples in this section, this one requires a bit specific settings for the used indicator as the data is not already available as an indicator and inserting it manually would require separate manual calculations.
Let's start by creating an indicator that measures revenue growth-% for selected period. As we are using data from financial indicators to calculate the values and this indicator is used only in a metric, we don't need to worry about any of the indicator settings, only about the formula. Revenue growth-% for each period can be calculated with following formula:
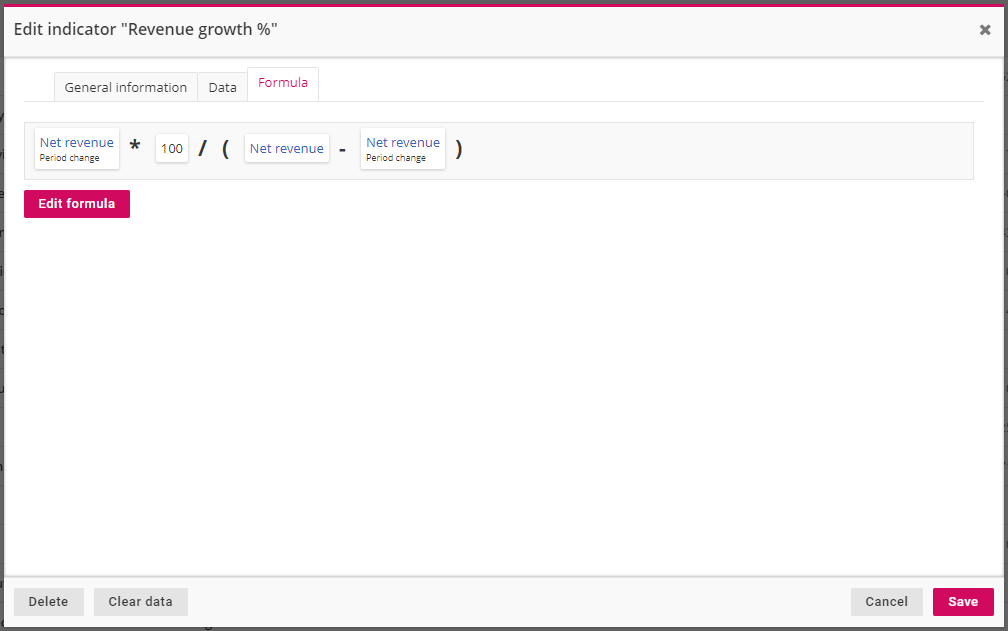
As we currently can't add the values of previous period as a variable, we have to find a bit creative way to create the formula. In this case, we can conduct the values of the previous period by deducting the change in value over the chosen period from the current period value.
After creating the new indicator, we can add the metric with the following settings:
- For indicator, we'll select "revenue growth %" that we just created
- Period selection is set as "Year" as they measure the progress of Yearly values.
- Achievement logic is set as "Achieved on each period", target value as "5" since the indicator shows values as percentages.
- Start value is imported from the indicator values, but was manually set as 0 (for explanation, see notes below the picture).
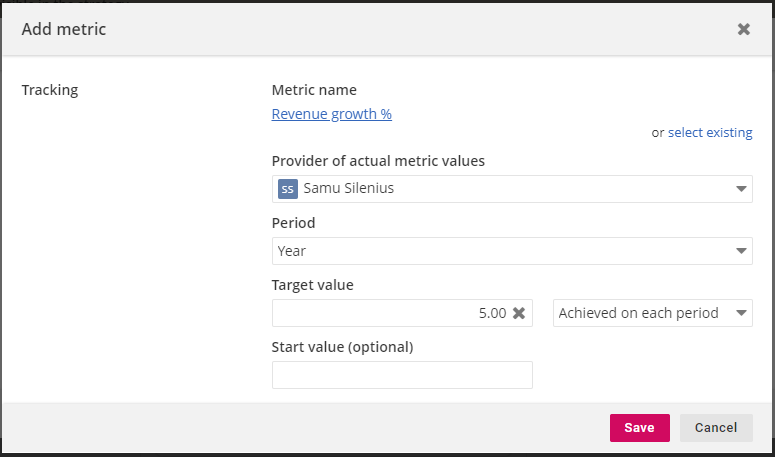
Start value is calculated based on current year's cumulative revenue against last year's full revenue, so the values are most likely negative before the last months of the year. Therefore, it might be reasonable to set it as 0 because having a negative start value distorts the progress measurement.
Metrics and OKR
The metric functionality can be especially useful in OKR approach as the Key Results are intended to be objective and quantitatively measurable and metrics visualize exactly this type of information. Tracking the progress of a Key Result with a metric also allows the organization to partially automate the process - if an organization has set a Key Result of achieving e.g. 500,000 € of sales in their key accounts, they can connect the metric to the data transferred from their financial system after which its progress is updated automatically for each status update. By actively utilizing metrics in their Key Results, organizations can eliminate a lot of manual work and use that time for more productive work.
Example of setting OKRs with metrics
In this example, company A has a company-level Objective of creating a world-class sales organization. As a part of achieving this Objective, company A has identified that they need to achieve growth in their customer segment alpha, as it is by far their most profitable one. Thus, they have set a Key Result of 15% growth of sales in customer segment alpha for the upcoming quarter. This company-level Key Result cascaded as an Objective to their sales department and they have identified that they need to contact more segment alpha clients to achieve this goal. Thus, they form a Key Result of contacting 15 clients from customer segment alpha.
This type of OKR strategy can be modelled in two ways in 4straction.
- Assign "Create a world-class sales organization" as a Strategic goal, "15% growth of sales in customer segment alpha" as an Objective and "Contact 20 clients from segment alpha" as a Key Result.
- Assign "Create a world-class sales organization" as an Objective, "15% growth of sales in customer segment alpha" as an Key Result and "Contact 20 clients from segment alpha" as a Task.
Out of these options, let's choose option number 1 as it can better demonstrate the use of metrics.
First, company A added "Create a world-class sales organization" as a Strategic goal. Then, they added "15% growth of sales in customer segment alpha" as an Objective with preferred settings: set effect time as next quarter, tagged responsible teams and used correct custom fields etc. Progress calculation method was set as "Progress key result average" as they wanted to have the Objective updated according to the progress of the Key Results. Then, in order to concretize the progress of achieving this objective, they decided to add a metric that tracks the revenue growth in this segment.
They added this metric to their Objective with following settings:
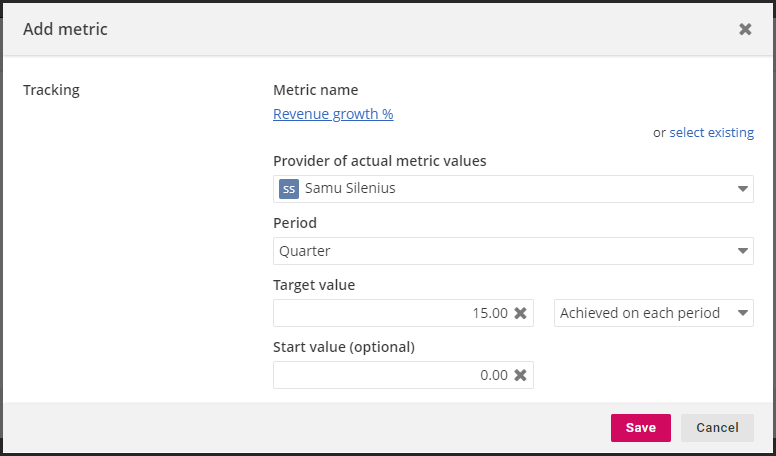
- As indicator, they chose "revenue growth %" and added set a filter to show only customer segment alpha's data.
- Period was set as a quarter
- Target value was set as "15" and achievement logic was set as "achieved on each period" as they wanted to track this growth persistently.
- Start value was imported from actuals, but it was changed to 0 due to how the indicator's values are calculated
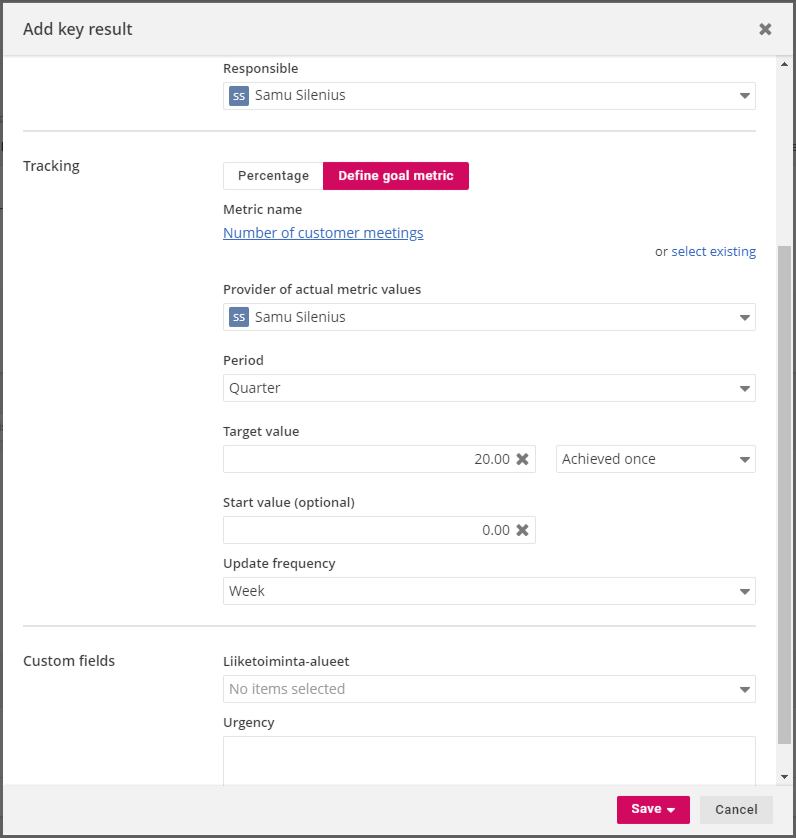
Then, they added "Contact 20 clients from segment alpha" as a Key Result under this objective. This Key Result was added as an metric that tracked how many customers from alpha segment they had contacted. Existing indicator "Number of customer meetings" was added with a customer segment filter "Alpha". Period was set as "Quarter", target value as "20" and achievement logic as "Achieved once".
After adding the other Key Results to this Objective, company A has now successfully set up their OKRs for the upcoming quarter. By assigning a metric to each of their Key Results and defining that their Objective progresses based on these Key Results, they have eliminated most of manual inputs from their strategic work and adopted a genuinely objective approach to measuring the progress of their Key Results.
Measuring the progress of the Objective with Key Result metrics:
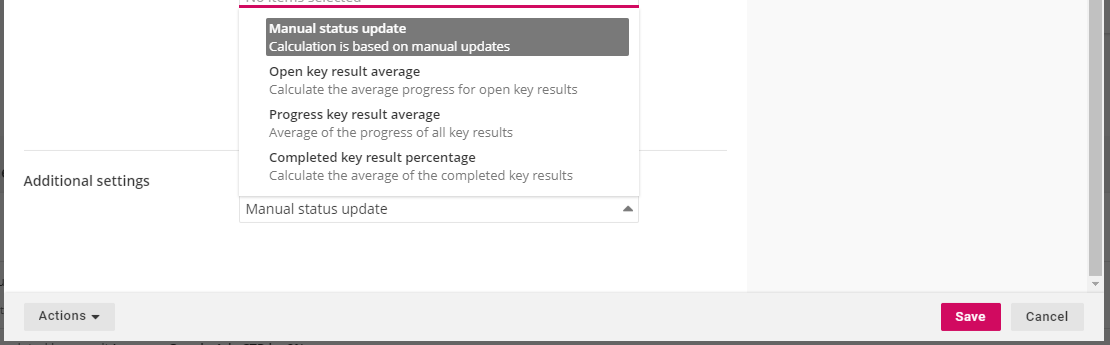
As seen in the previous example, if an Objective has Key Results that track their progress via metrics, these metrics can also be utilized in calculating the progress of the whole Objective. This is achieved by choosing one of the three following options as "Progress calculation method" in the Objective's settings:
- Open key result average, where the progress of the Objective is calculated based on the average progress for open Key Results. In this option, an average is calculated from the progress of the Key Results that are not yet closed.
- Progress key result average, where the progress of the Objective is calculated based on the average progress of all Key Results. In this option, an average is calculated from all of the Key Results under the Objective.
- Completed key result percentage, where the progress of the Objective is calculated based on the average number of completed Key Results. A Key Result is considered complete once it achieves 100% completion rate.
This functionality allows organizations to connect their Key Results directly to Objectives which eliminates the need to update them separately. In addition, it allows them to define how the progress for each Objective is calculated which supports different approaches to OKRs.