
Workshops consist of different types of work phases. Each work phase is meant for certain tasks, e.g. recognizing threats, evaluating items or familiarizing oneself with preparatory material. Besides having a certain function, work phases can also be chained together to create a desired flow in the workshop and, most importantly, reduce manual work. Work phases can also have different statuses which dictate their visibility and allow the facilitator to control the pace of the workshop.
1. Work phase types
There are currently 10 different work phases available:
- Identification
- Cross-pollination
- Two-dimensional rating
- Prioritization
- Light prioritization
- Questionnaire
- Comparison analysis
- Mindmap
- External content
- Workshop results
.png)
1.1 Identification
Identification is the most essential part of any workshop as the participants can provide completely new insights during it. Some of the other work phases are also completely based on items discovered in identification phase(s) which makes it one of the most important phases of any workshop. Identified items can be almost anything, e.g.:
- Threats or possibilities
- Weaknesses or strengths
- Competitors or other stakeholders
- Phenomena, trends or themes
- Initiatives
- Goals or key results
- Suggestions for actions
- Ideas
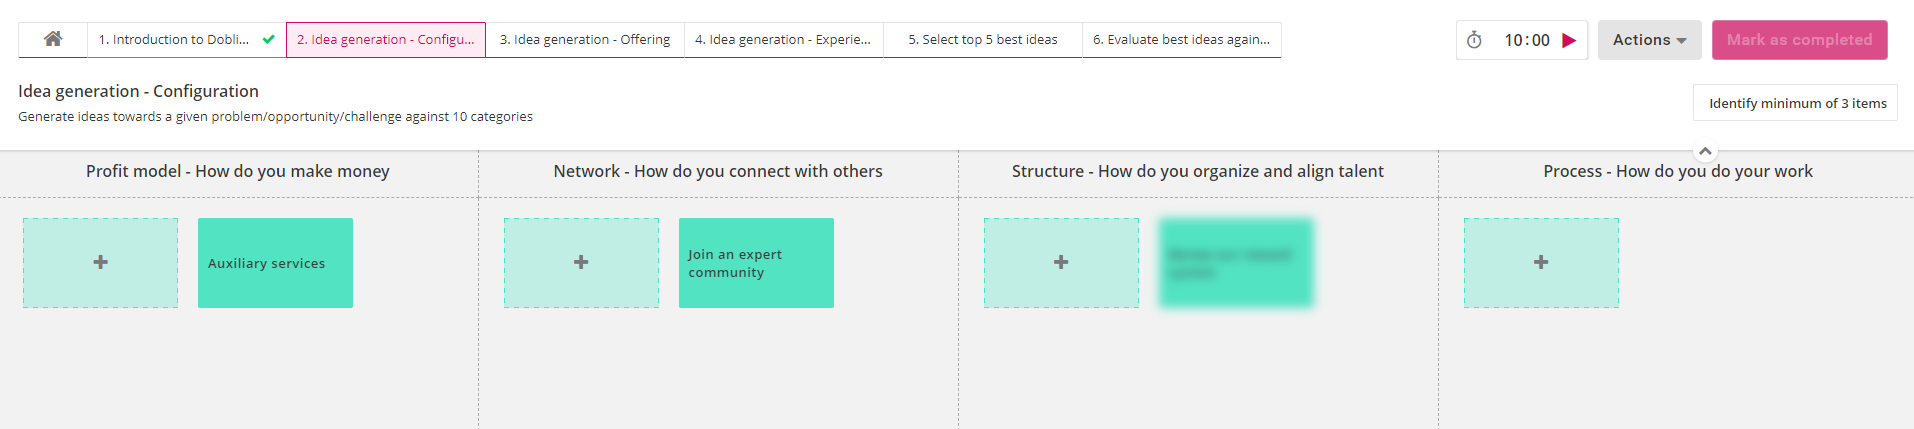
Identification can metaphorically be seen as a flip chart, where participants add post-it notes. The flip chart can be divided into one or several categories which appear as different horizontal lanes. Each category can also contain different types of card types, if you want to separate e.g. internal and external factors for selected categories.
Participants add new items to the chart by clicking the pluses in each category. When adding an item, they insert a short name for it and a more accurate description, if additional clarification or context is needed. Participants can move or edit their own items after first placing them as long as the work phase is still in progress.
Useful identification settings:
Identification phases can look very different depending on the active settings. Some of the most useful settings are listed below:
- Setting a threshold for amount of identified items: The facilitator can define how many items each participant has to add before they can mark the work phase as completed or see items added by the others. This can ensure a sufficient amount of answers and encourage participants to bring their own, unique insights which improves the overall diversity of the results.
- Generating categories from a source: Instead of manually inserting all categories in the workshop, the facilitator can generate identification categories from existing structures: other workshops, work phases, strategy structures or market structures. This feature can be used to e.g. import current strategic goals, so that you can plan short-term objectives for them or 5 best-rated items from another work phase. If the categories are imported from another work phase, facilitator can select to import a certain number of items and select if they are imported based on descending or ascending order.
- Generating cards from a source: Instead of requesting participants to add cards in the identification phase, the facilitator can import them from existing strategy or market structures. This feature can be used to e.g. import strategic objectives as cards, so that you can rate or prioritize them in another work phase. This option is often used if you have certain items that you want to quickly import to the workshop and have participants working on fixed topics.
- Setting colors for categories and card types: setting colors for the categories and card types can help everyone to distinguish different items from one another both during the identification and other work phases. This feature can be used e.g. if you are rating items from several identification phases and you want to make it easier for participants to tell different categories apart. In some cases, coloring can also signal other things, e.g. Doblin's 10 types of innovation form 3 main categories that have their signature colors.
1.2 Cross-pollination
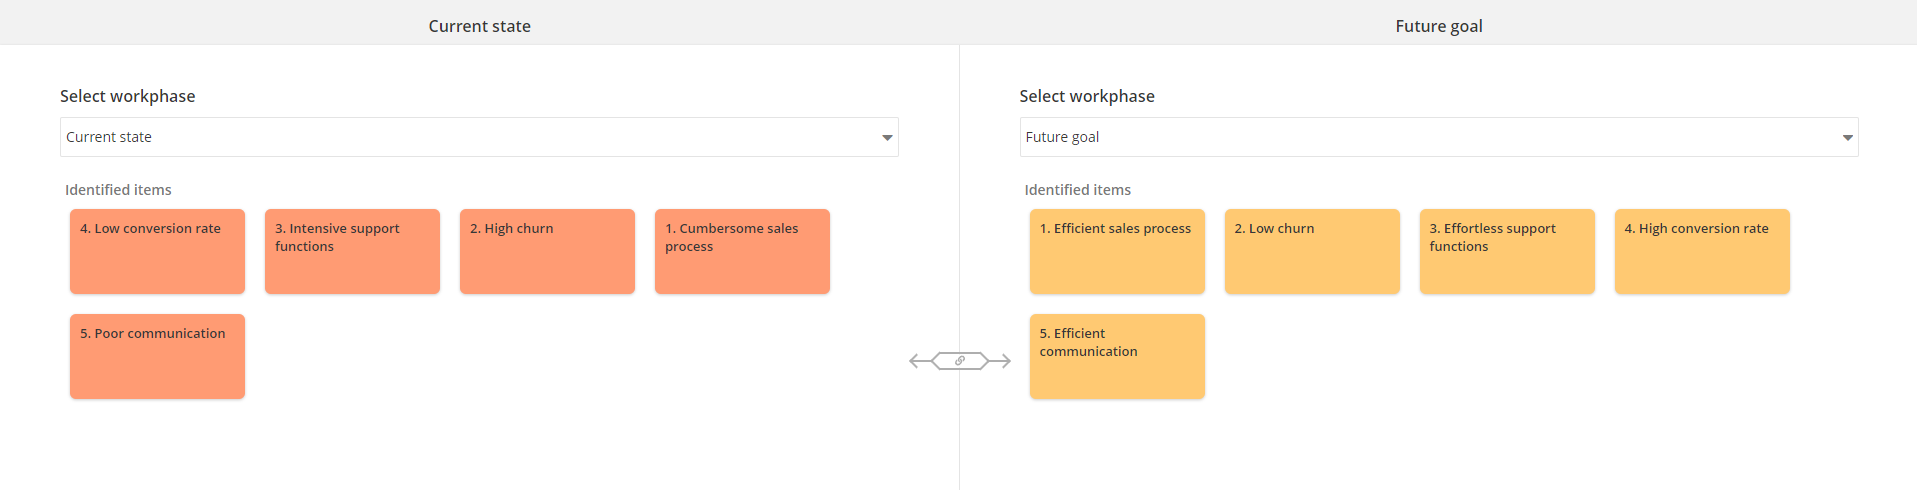
In cross-pollination, the participants identify common factors between the items from two separate identification phases. Cross-pollination can be used for e.g. identifying common factors between strategic breakthroughs to find a concrete action that could help the organization to achieve both of these breakthroughs. When adding a cross-pollination, the facilitator first has to choose which of the chosen identification phases is on the right and which one is on the left*. All of the identified items will be shown from both of the chosen phases.
*Note: the decision of placing an identification phase left or right is purely cosmetical.
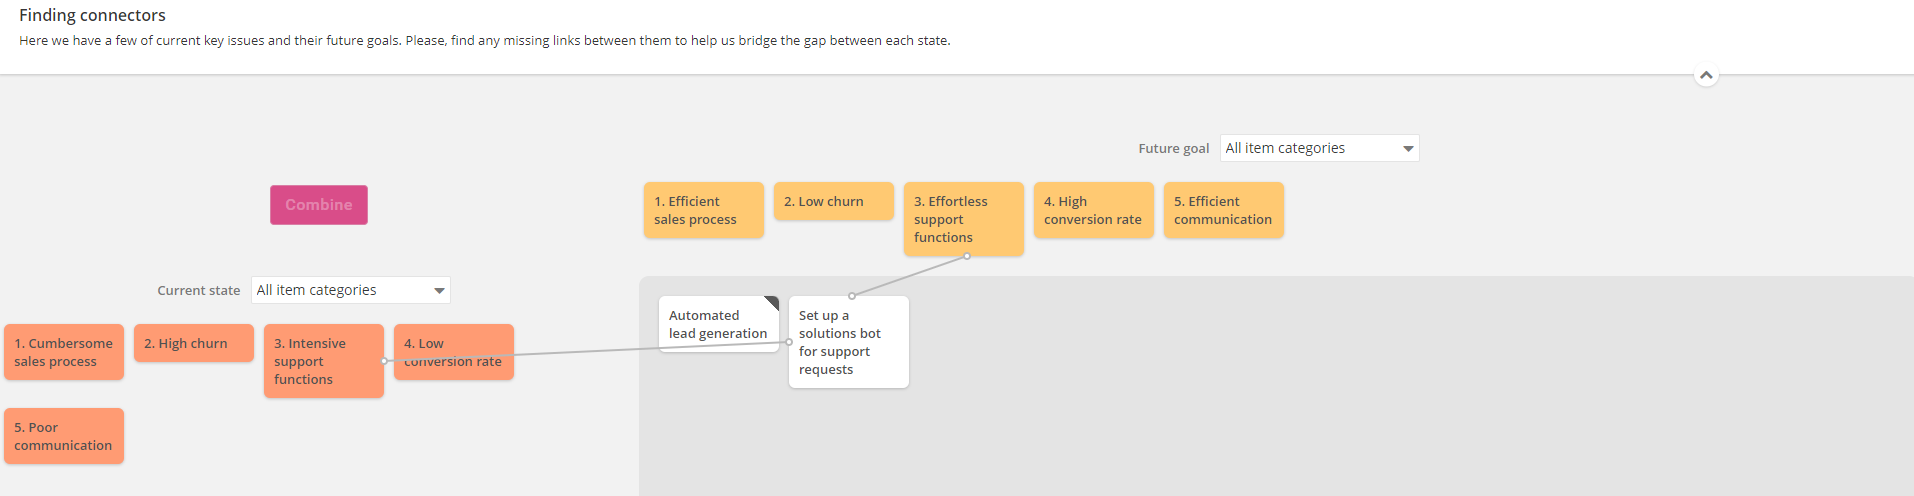
Once the identification phases are chosen and the work phase is published and activated, the actual cross-pollination begins. The cross-pollination works by choosing one item from each side after which they can be combined by clicking on the red "combine" button. Combining two items results in a new item that can be given a title and a more detailed explanation.
Combinable items can be filtered on both sides based on the categories of the respective identification phases. By hovering over the combined items, participants can see which two items were combined. By hovering over the items that can be combined, the system highlights all the combinations which include this item.
1.3 Two-dimensional rating
In two-dimensional rating, items are rated against an area bordered by two axes that indicate value in selected category. The facilitator can define the area to consist simply of an y- and a x-axis or form it as a grid of preferred size. Each part of the grid can have a separate description which enables more detailed instructions for the participants. Note that despite the grid parts having customizable descriptions, the results of the grid are still evaluated against the items' positions in the y- and x-axis and the grid thus serves more as a guideline.
The rating of items occurs by dragging identified items to preferred spots in the area. Users can hover over rated items to see their description-fields which often contain important context. If an item is left unrated, it will also not affect the results which can be helpful in case a rated item is somehow unclear to the participant.
Useful two-dimensional rating settings:
Two-dimensional ratings can be very different depending on the active settings. Some of the most useful settings are listed below:
- Rating area type*:The rating area can be either a single zone or a grid. Grids can be either in 2x2, 2x3 or 3x3 format and each grid can have a signature color and an explanation.
- *Note: you need to have the work phase as "unpublished" in order to edit the rating area type.
- Rating a limited number of items: If the rated items are results from another two-dimensional rating or a prioritization, the facilitator can decide how many items are rated and if the items are items with the worst or best ratings. This can be utilized in e.g. iterative rating processes, where you start with 20 rated items and in each subsequent rating there are 5 less items until there are 5 best-rated items left.
- Rating multiple work phases: The rated items don't have to be from a single work phase, they can be from multiple work phases. This might be useful in case the workshop is very segmented and there are several different roles for the participants, and you want to rate all identified items at the same time.
- Setting weights: It is also possible to set weights for the rated items. Weights can be assigned separately for each rated work phase and the weights can be set either a) for all items of that work phase, b) separately for each category of that work phase or c) separately for each card type category of that work phase. Setting weights allows more complex approaches towards the ratings; facilitator can set e.g. higher weights on certain items, therefore boosting their results, if they carry larger significance in terms of bigger picture.
- Allow rating of own items: Allowing participants to only rate items added by other people can sometimes be beneficial. It can promote more democratic results since participants can't just boost their own items.
Special feature: analyzing results and the spread
In the two-dimensional rating results, each item is placed on the rating area based on the average value from all participant ratings. By default, the color of each item is based on their category in the identification phase. This allows the facilitator and participators to quickly see how items in each category were rated; e.g. was one category considerably highly rated or did one category perhaps have a high spread between its items? Instead of using the categories of the identification phase, users can change the colors to indicate the spread of the ratings from top left corner of the results. While showing spread, green and greenish tones indicate low spread, yellow medium spread and red and reddish tones indicate high spread. The data on the spread of the ratings can be especially useful for the facilitator when they are summarizing the results. The facilitator can analyze e.g. the spread of a single item's ratings, the spread of the items with highest spreads or the average spread of all of the ratings. The spread signals the consensus of the participants regarding the covered topic and can give certain depth to the follow-up conversations and later work phases.
It is also possible to filter the ratings based on a selected participant role from the top left corner (see more about roles in workshops in section "Workshop settings, participants, roles and public links"). Clicking on a single item shows the spread of answers for that particular item which can provide additional information in certain cases.
Besides using the data on rating spreads, the facilitators can adapt different approaches for running the workshop and analyzing the results. They can utilize e.g. Wideband Delphi method, where there are several rating rounds for the same items. After the first rating round, the results are summarized and a joint discussion will be held with the participants about the different views on the topic and their possible reasons. This discussion can often increase the participants' understanding of their own point of views and underlying motives. After the discussion, the facilitator can remove the ratings from the actions-menu and the participants will do the rating again.
1.4 Prioritization
The purpose of prioritization is to find items with the most significance or support from participants. Each participant can allocate stars to their preferred items and they can allocate as many stars as they want to. The amount of available stars can be set by the facilitator.
The end result is a clear list of items which have received the most votes. The results from prioritization can then be used in e.g. another prioritization or two-dimensional rating by including only items that have received a certain amount of stars or any stars.
The results can be shown as a chart, column or table that each show a bit differently how the items were prioritized. Below we can see an example of the chart:
Useful prioritization settings:
- Number of available votes: Facilitator can set the amount of available votes to be a) half of the number of items, b) equal to the number of items or c) any custom value. The number of votes affects the polarity of received answers; low amount of votes forces participants to vote for only the best/worst options.
- Prioritizing a limited number of items: If the voted items are results from a two-dimensional rating or a prioritization, the facilitator can decide how many items are voted and if the items are items with the worst or best ratings. This can be utilized in e.g. iterative prioritization processes, where you start with 20 items and in each subsequent prioritization there are 5 less items until there are 5 "best" items left.
- Prioritizing multiple work phases: The voted items don't have to be from a single work phase, they can be from multiple work phases. This might be useful in case the workshop is very segmented and there are several different roles for the participants, and you want to vote for all identified items at the same time.
- Setting weights: It is also possible to set weights for the voted items. Weights can be assigned separately for each voted work phase and the weights can be set either a) for all items of that work phase, b) separately for each category of that work phase or c) separately for each card type category of that work phase. Setting weights allows more complex approaches towards the prioritizations; facilitator can set e.g. higher weights on certain items, therefore boosting their results, if they carry larger significance in terms of bigger picture.
- Allow voting for own items: Allowing participants to only vote for items added by other people can sometimes be beneficial. It can promote more democratic results since participants can't just boost their own items.
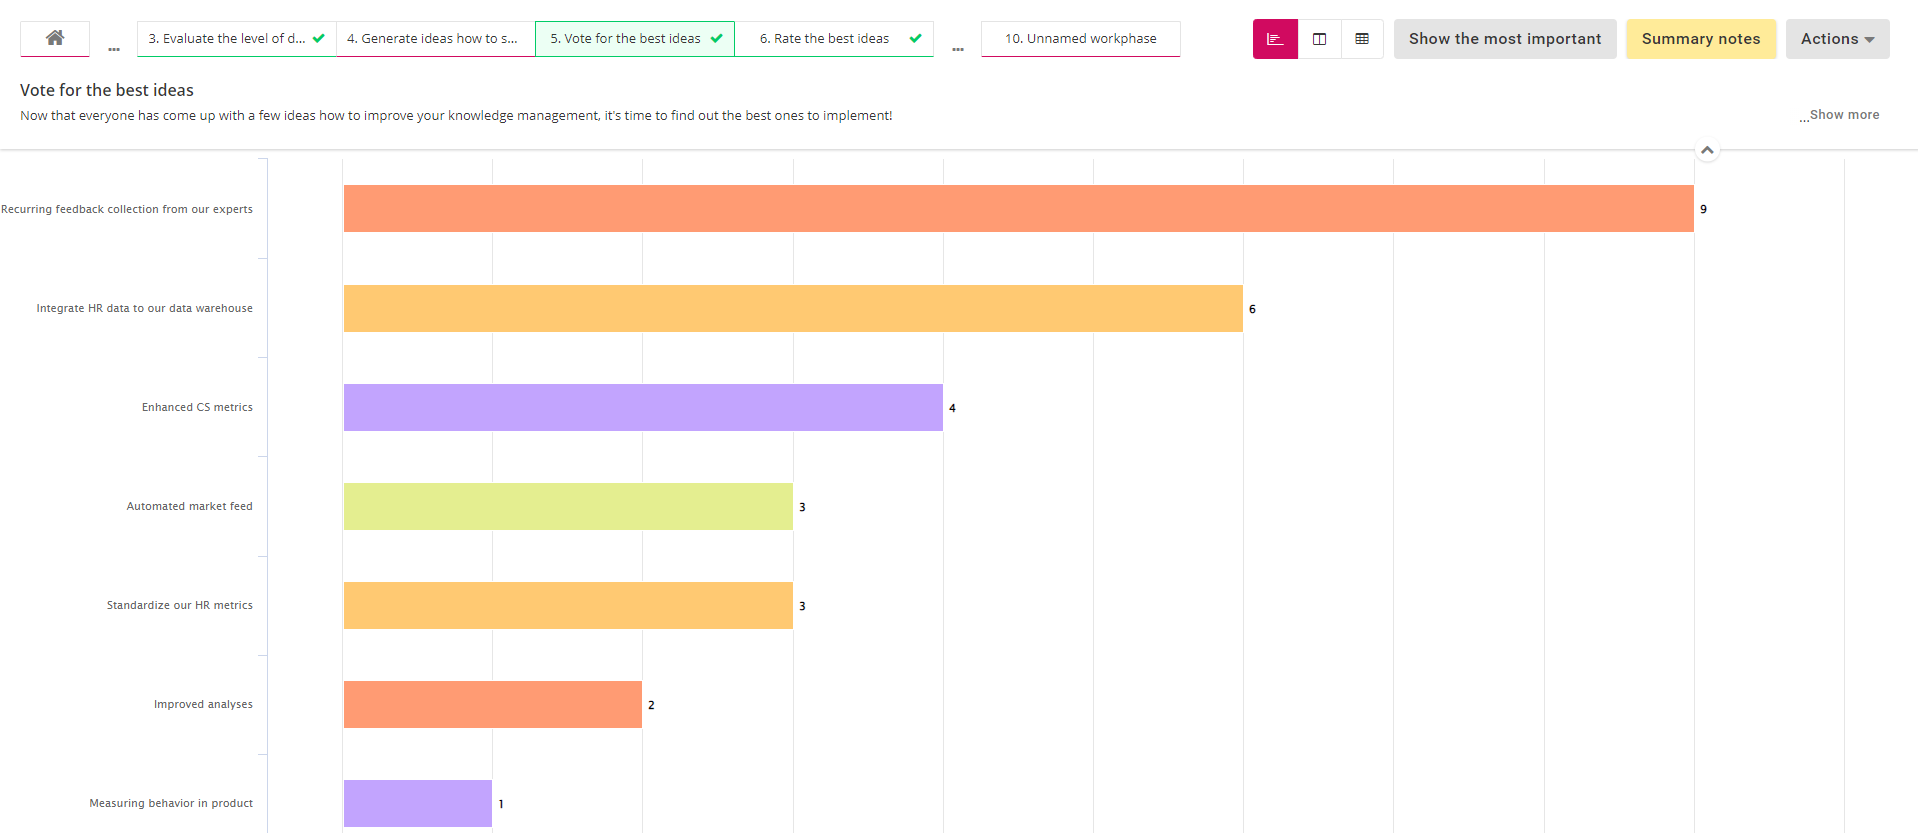
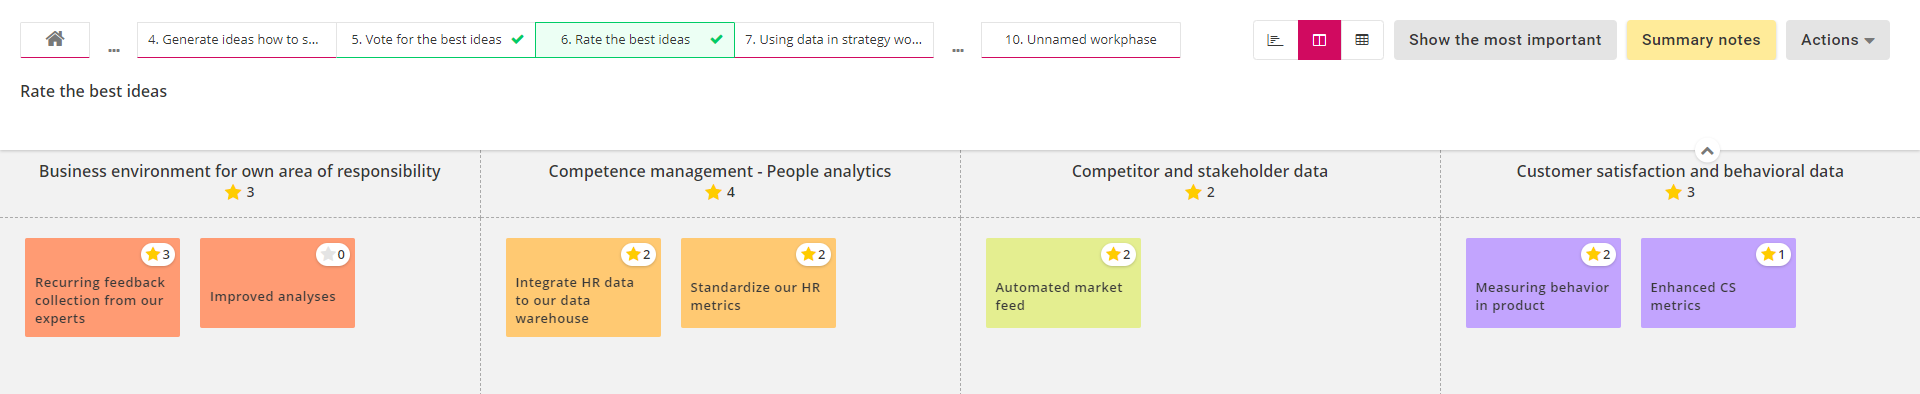
1.5 Light prioritization
The purpose of light prioritization is to quickly discover the most crucial items from the set of identified items. Each participant can allocate stars to their preferred items, but each item can only receive one star which forces the participants to spread their votes a bit more. The amount of available stars can be set by the facilitator.
The end result is a clear list of items which have received the most votes. The results from light prioritization can then be used in e.g. another prioritization or two-dimensional rating by including only items that have received a certain amount of stars or any stars.
The results can be shown as a chart, column or table that each show a bit differently how the items were prioritized. Below we can see an example of the column option:
Useful prioritization settings:
- Number of available votes: Facilitator can set the amount of available votes to be a) half of the number of items, b) equal to the number of items or c) any custom value. The number of votes affects the polarity of received answers; low amount of votes forces participants to vote for only the best/worst options.
- Prioritizing a limited number of items: If the voted items are results from a two-dimensional rating or a prioritization, the facilitator can decide how many items are voted and if the items are items with the worst or best ratings. This can be utilized in e.g. iterative prioritization processes, where you start with 20 items and in each subsequent prioritization there are 5 less items until there are 5 "best" items left.
- Prioritizing multiple work phases: The voted items don't have to be from a single work phase, they can be from multiple work phases. This might be useful in case the workshop is very segmented and there are several different roles for the participants, and you want to vote for all identified items at the same time.
- Setting weights: It is also possible to set weights for the voted items. Weights can be assigned separately for each voted work phase and the weights can be set either a) for all items of that work phase, b) separately for each category of that work phase or c) separately for each card type category of that work phase. Setting weights allows more complex approaches towards the prioritizations; facilitator can set e.g. higher weights on certain items, therefore boosting their results, if they carry larger significance in terms of bigger picture.
- Allow voting for own items: Allowing participants to only vote for items added by other people can sometimes be beneficial. It can promote more democratic results since participants can't just boost their own items.
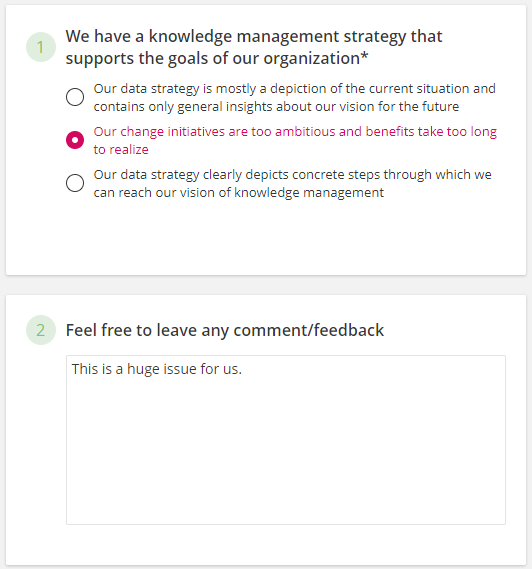
1.6 Questionnaire
Questionnaires allow the facilitator to incorporate light data collection via questions as a part of any workshop. By utilizing public links, the workshop questionnaires can also be used for large-scale data collection. The questions can be multiple choice or text field questions and the facilitator can set answering as mandatory to some or all of the questions.
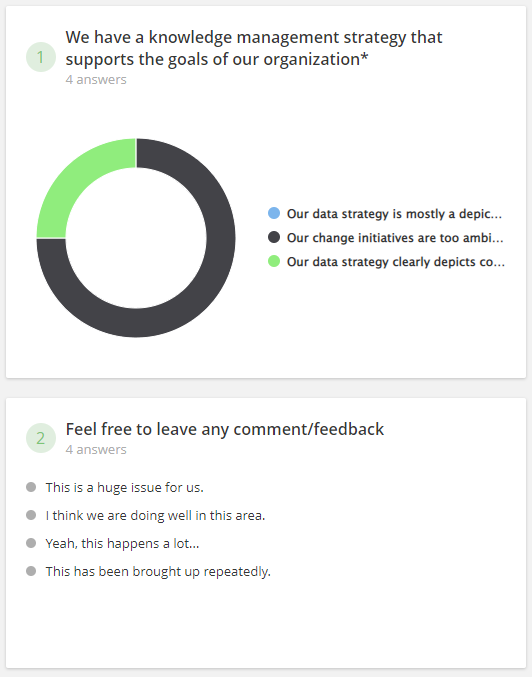
The results show the number answers for each question; multiple choice answer shares are shown as a visual pie chart and open text answers as a list.
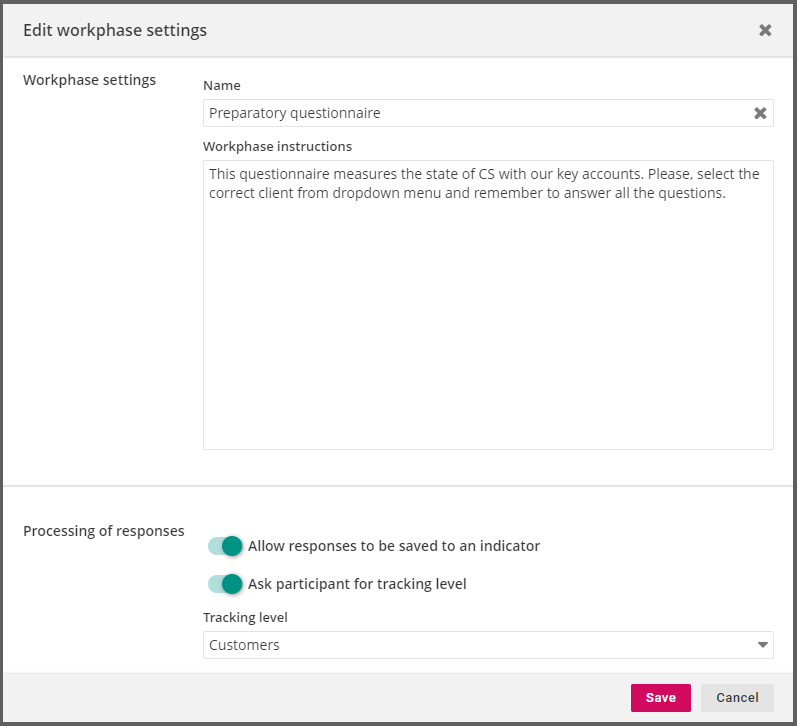
Special feature: Saving the answers to an indicator
Questionnaires can also be formed so that the answers will be automatically saved to an indicator which enables the use of collected data in other service modules as well. The collected answers can also be allocated to a tracking level item which enables the collection of e.g. team-, project- or client-specific data.
Saving the data to an indicator and asking for tracking level items can be activated from the bottom of the questionnaire's settings.
When saving responses to an indicator is activated, the indicator can be defined separately for each question. Each answer option also needs to have a value it represents. These are done in each question's settings.
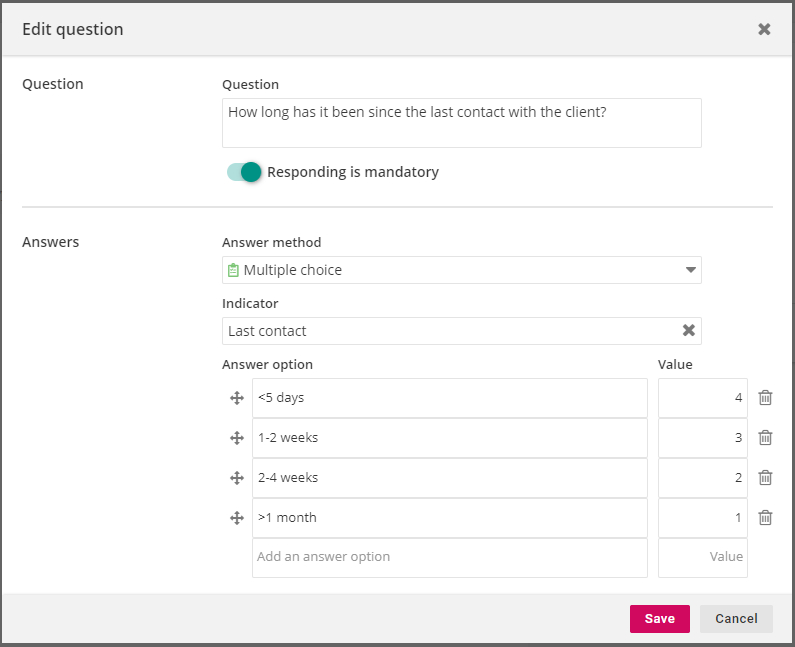
Saving the answers to an indicator is allowed only for multiple choice questions. In addition, the allocation of data to a tracking level item is done for every answer in questionnaire and only one item can be picked in each questionnaire.
1.7 Comparison analysis
In the comparison analysis, the participants rate pre-defined items in different categories. It can be used e.g. for competitor analysis or any other type of flexible analysis, where the rated data is divided between several categories and all of these categories need to be taken into account to conclude the results.
The comparison analysis has three different comparison settings (these are defined at the bottom of the comparison analysis' settings):
- Rating scale which means the scale on which the items are going to be rated on. The scale contains a set of values which each have a numerical value for calculating the answer averages. The number of values is not limited, but there needs to minimum one value set.
- Comparison dimensions which means the different categories that the items are going to be rated on. These dimensions will be added in text form and each dimension forms its own section to the x-axis.
- Rated items which means the items that are going to be rated in the different dimensions. Each added item will have its own color, so that they are easier to tell apart.
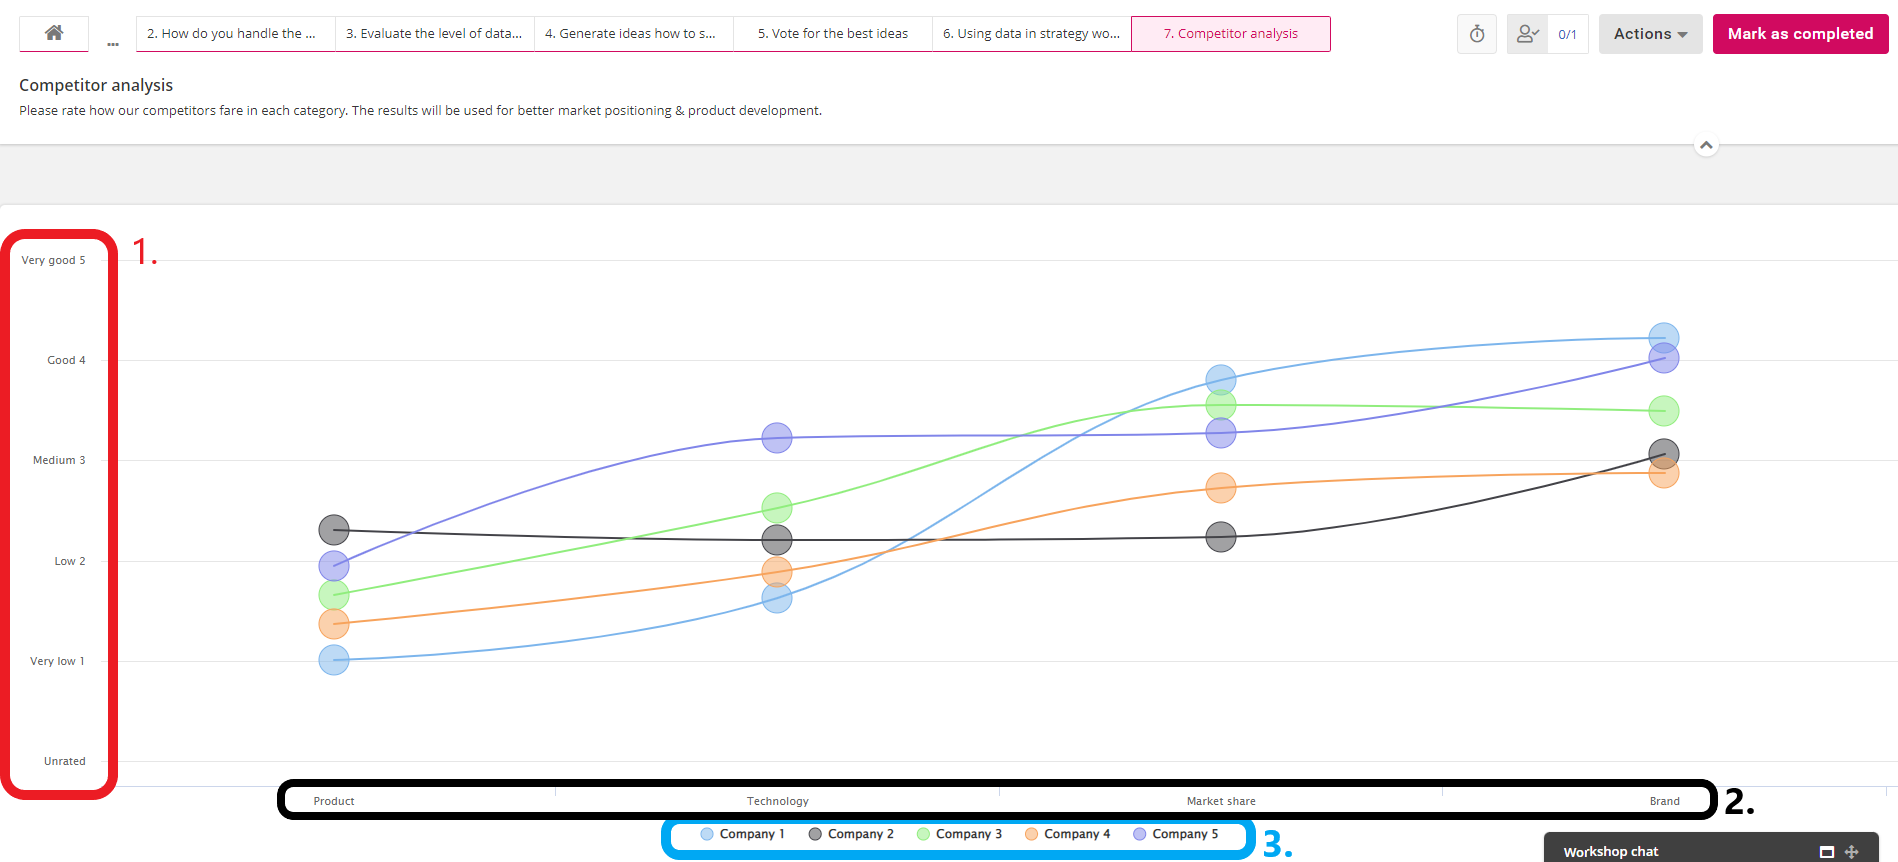
When the comparison analysis is in progress, the participants will rate the items in each category by dragging the colored "balloon" to a preferred spot on the rating scale. For example, below you can see a picture of an competitor analysis, where the participants are rating the perceived success of competitors in each category of selected competitive advantage factors.
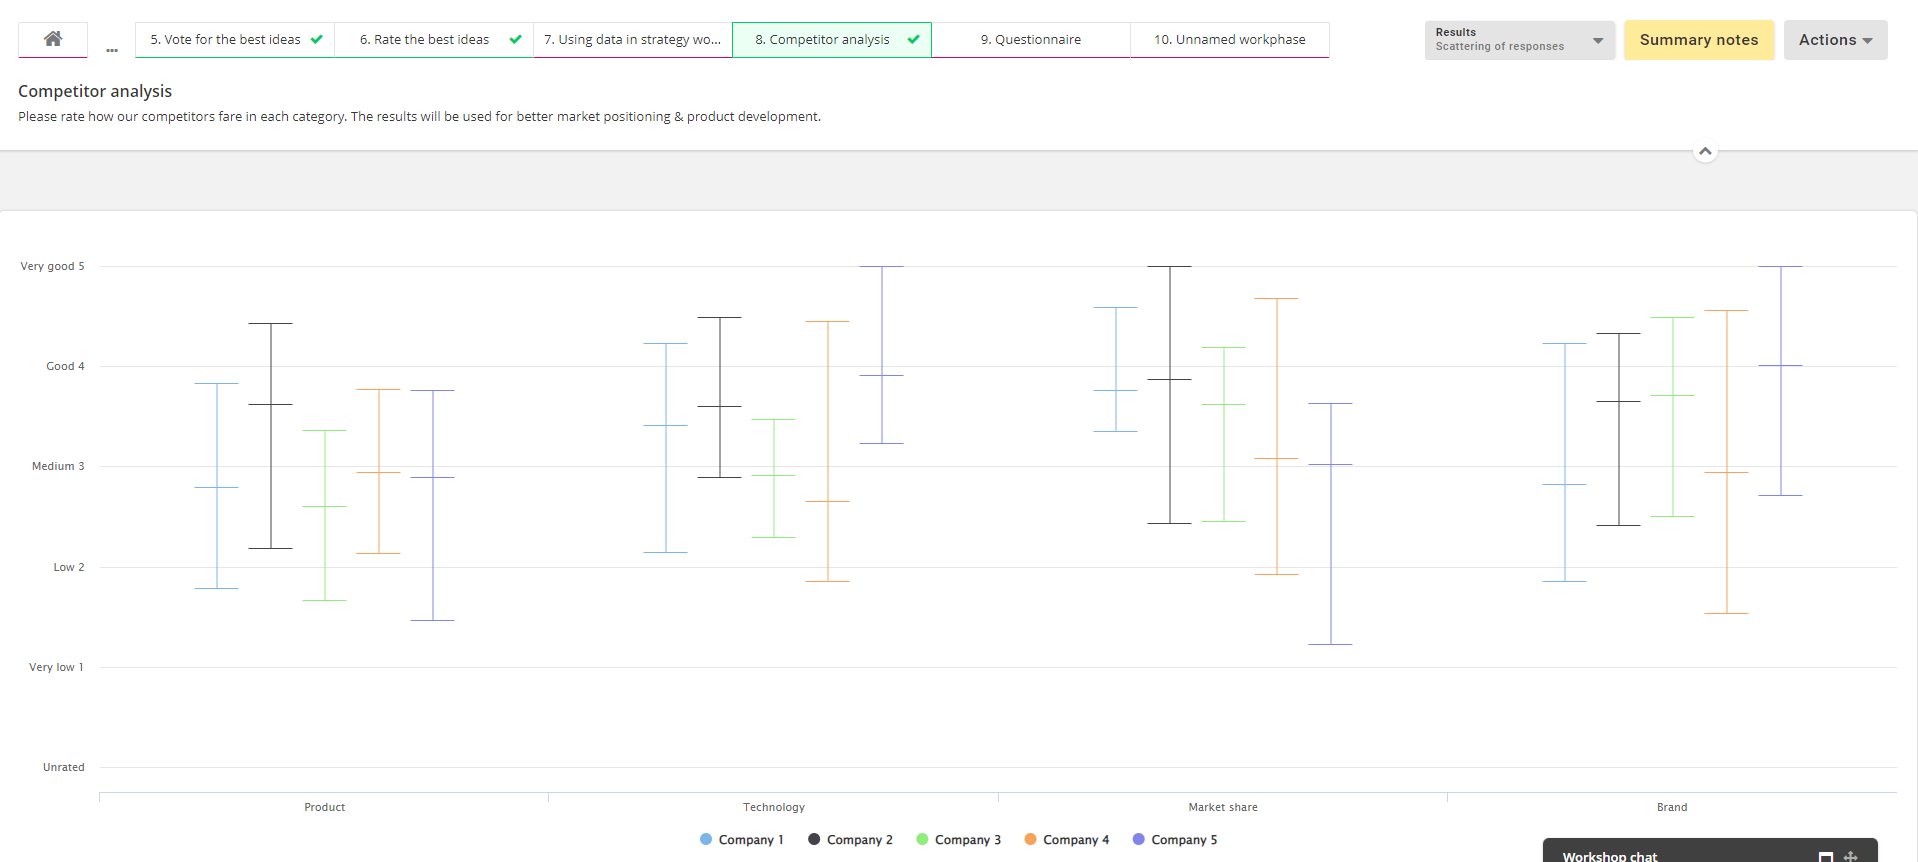
Special feature: analyzing results and the scatter of responses
After the comparison analysis is finished, an average will be calculated from all the answers and shown as the phase results. You can also select to show the scattering of results which helps you see how unanimous the answers were for each item and dimension. This can help you interpret the results more accurately; did the most highly rated items receive good evaluations from all participants or were there some deviation in responses?
1.8 Mindmap
In mindmap-workphase, participants can add new items from selected categories to form a tree structure. This workphase suits especially well for planning and identifying objects in or related to shared hierarchical structures, e.g. strategies or organization chart. If certain elements are added to a workshop template, facilitators can ensure that certain upper level structures exist and guide all participating teams which ensures more unified way of working.
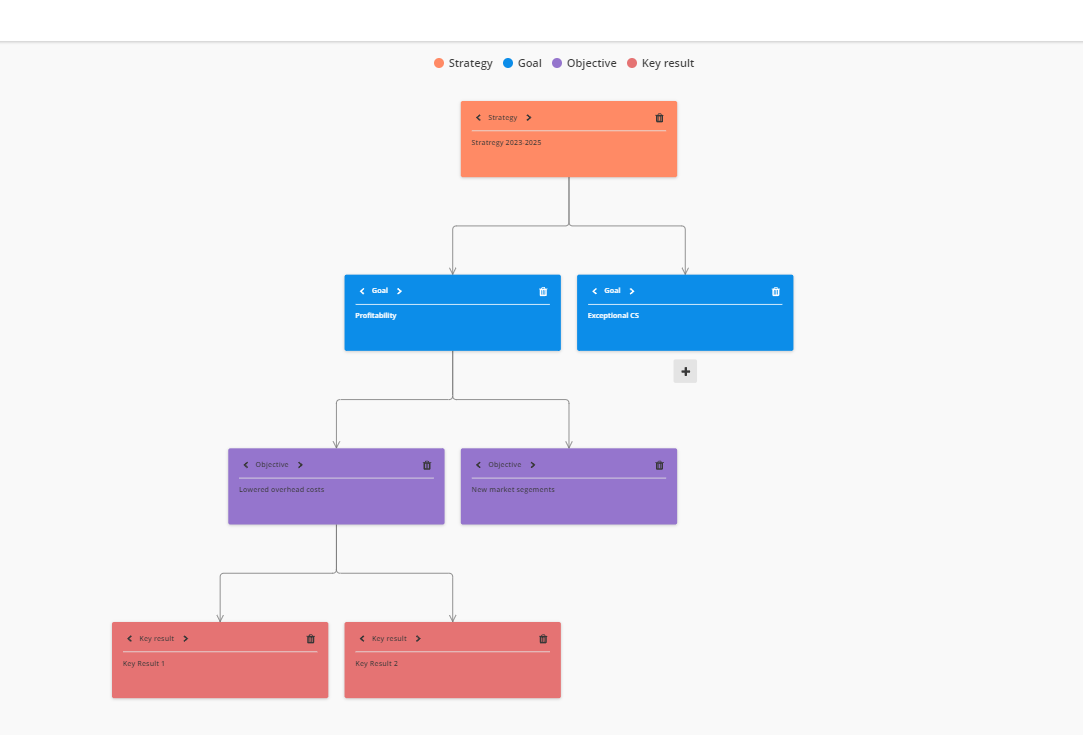
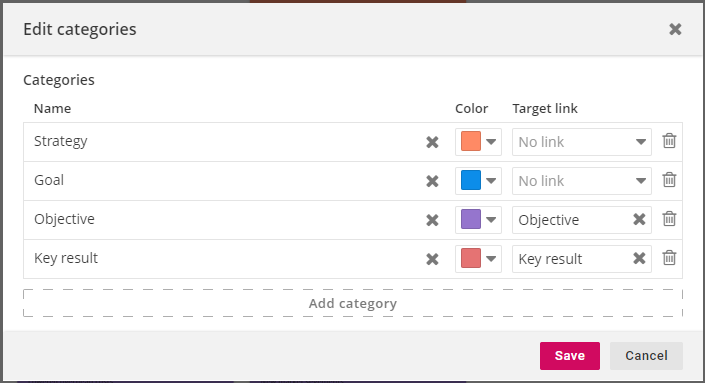
Special feature: mindmap node categories
It's possible to completely customize the available node categories in the mindmap. In addition to the name, it's possible to assign a signature color and link the node type with a strategy part type* (breakthrough/objective or action/key result). There is no limit to the number of categories providing support for multiple different approaches.
*this link is used if mindmap items are exported back to Strategy with the export tool
1.9 External content
The purpose of external content is to include additional materials and instructions that guide the participants and support them in reaching the goals set for the workshop. External content can be e.g. a website, pdf-file, a presentation (Powerpoint or Google Slide) or any type of text. The only requirement is that it's accessible through the provided URL.
External content can be either embedded to the workshop or, in the case of non-embeddable content, a link to another site where the content is located will be offered.
Worth noticing on using external content
Embedding content from other sources is not always allowed due to e.g. security protocols or log-in requirements. In these cases, the browser will show an error message while trying to show the external content: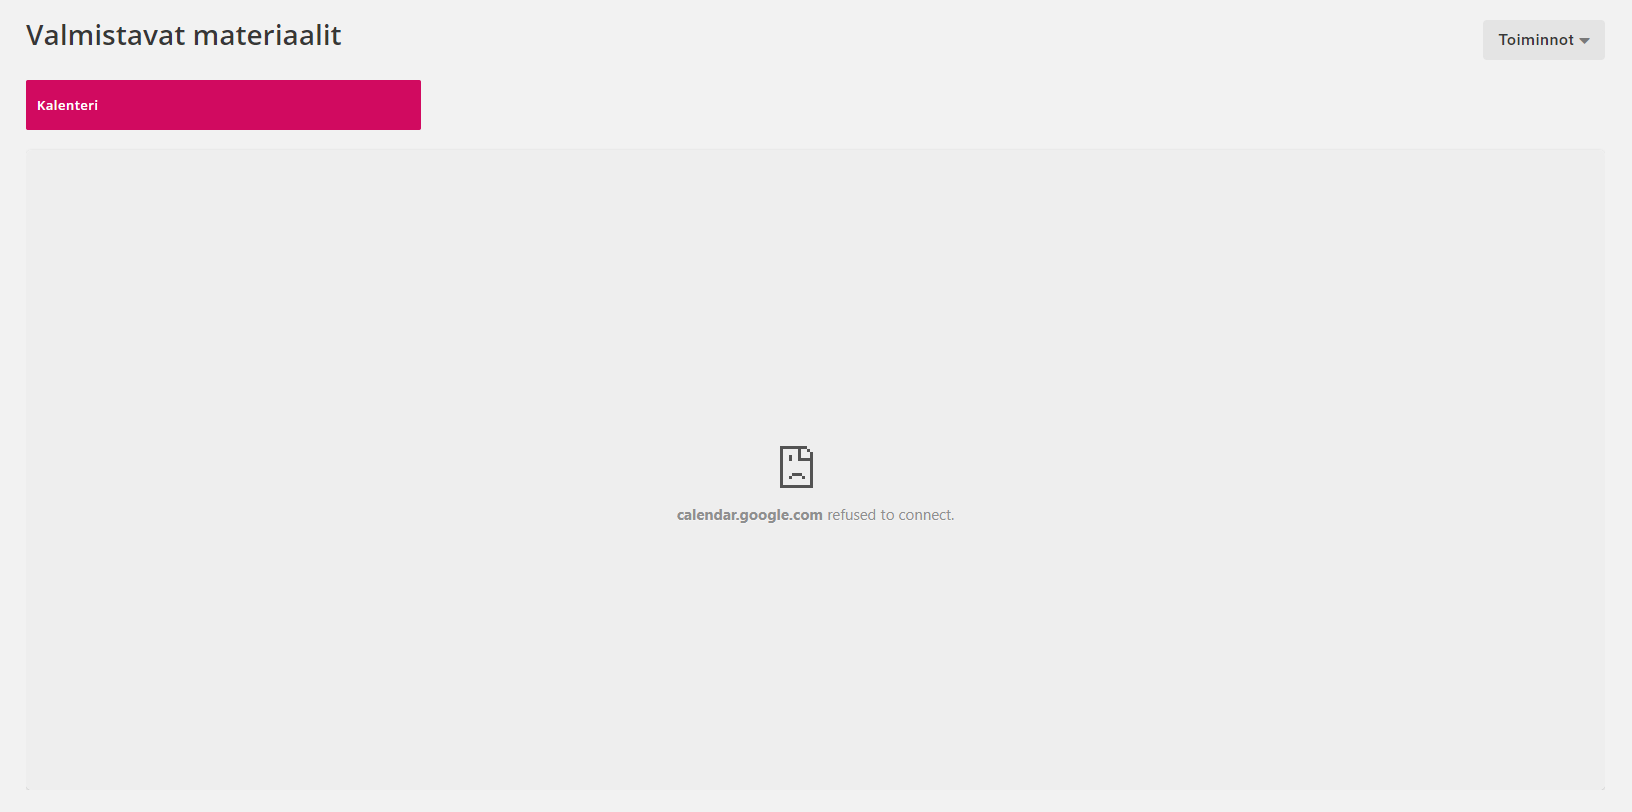
If the external content requires some form of authentication, the facilitator should make sure that all of the participants have access to it.
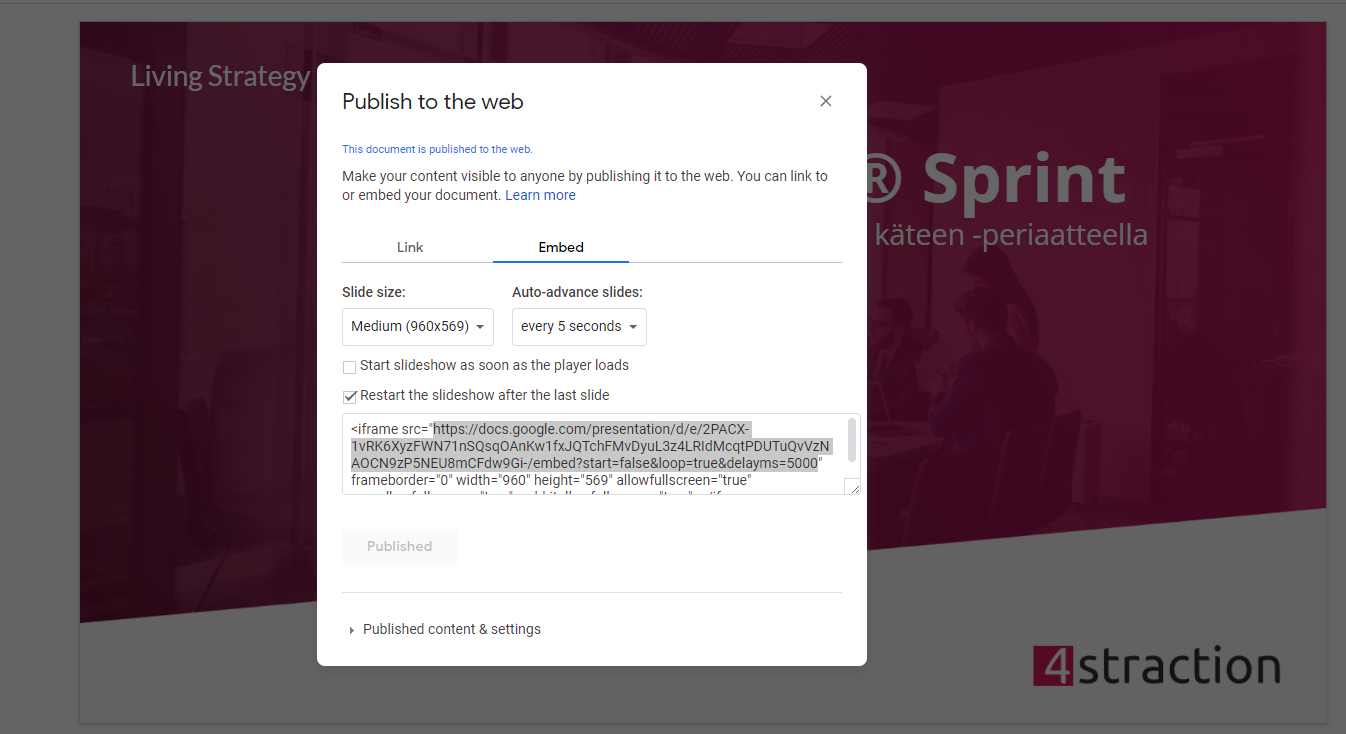
Some services offer separate functionalities that allow their content to be embedded in workshops. These functionalities are often called "Share", "Embed" or "Publish". For example, Google Slides, Google Sheets, Google Data Studio, Sharepoint or Powerpoint have these types of functionalities. However, sometimes these functionalities provide the link in wrong form. Luckily, when embedding this type of content, 4straction can recognize the correct form of the link in the most cases.
For example, if you publish a Google Slides presentation as embeddable content, the link will contain additional characters which will cause the embedding to fail in the workshop. As only the URL is needed in this case, the provided link will need to be partially copied starting from "https:" and ending with "delayms=5000".
1.10 Workshop results
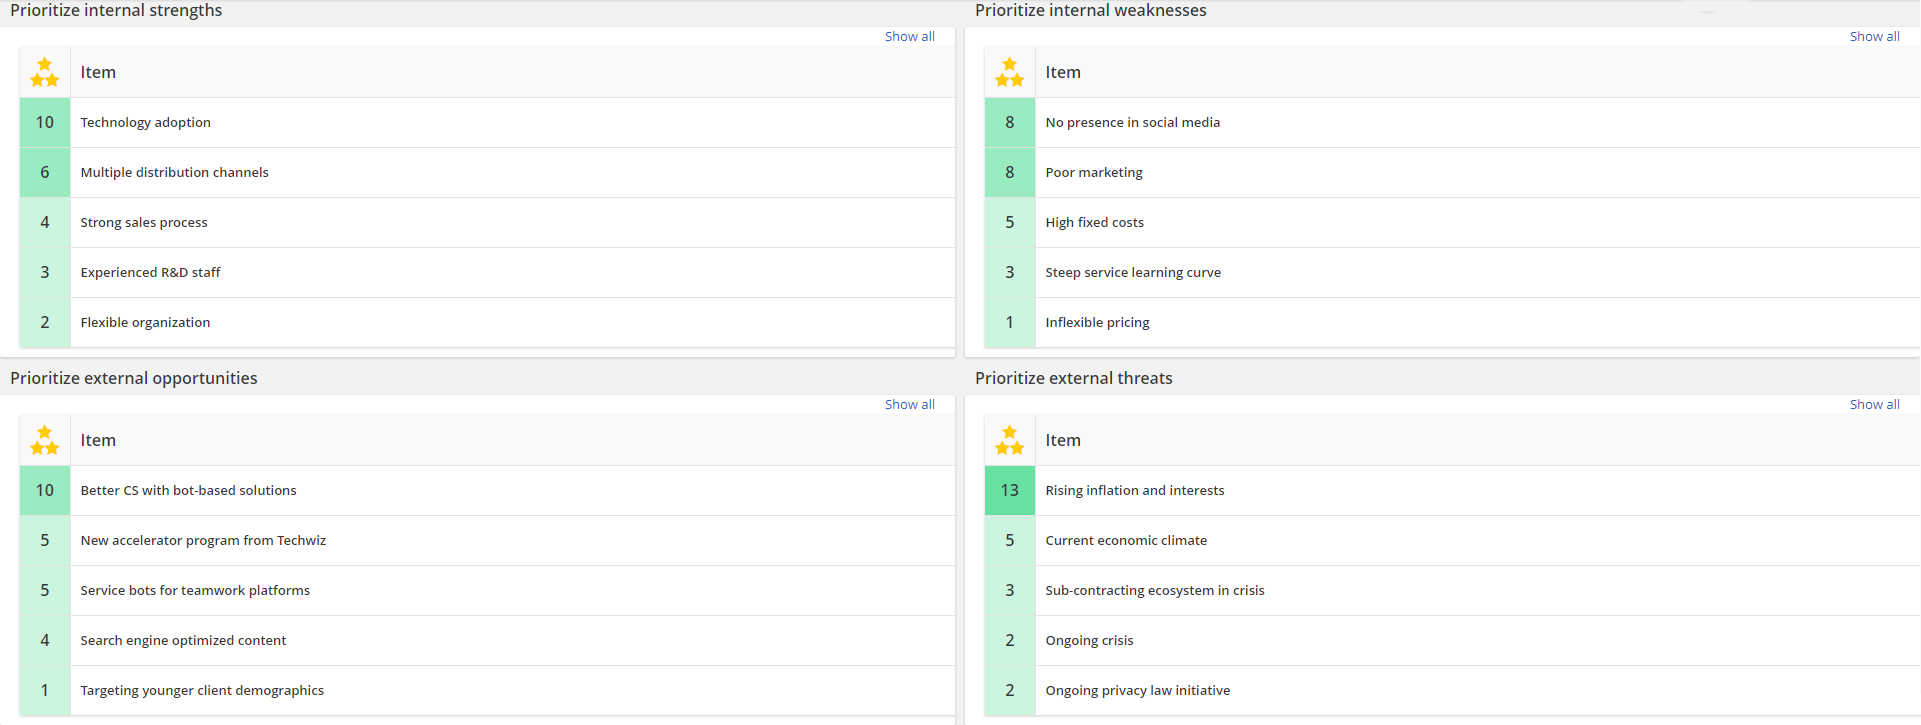
It is possible to import results from other workshops and other work phases in the same workshop, for example, as preparatory material for participants. This also allows the formation of workshop series or combining the results from several workshops for further analysis. Showing workshop results can also help you pace a workshop; if you have identified e.g. items in 4 different work phases, you can show their combined results to the participants before moving on to rating them.
Note that only work phases with actual results can be imported from another workshops. This means that external content cannot be imported, but these can be added as their own work phase again, if necessary. Results imported to a "workshop results"-work phase cannot be edited anymore which is why they work best as additional support material. Below is an example of showing SWOT results in a 2x2 format:
2. Workshop structure
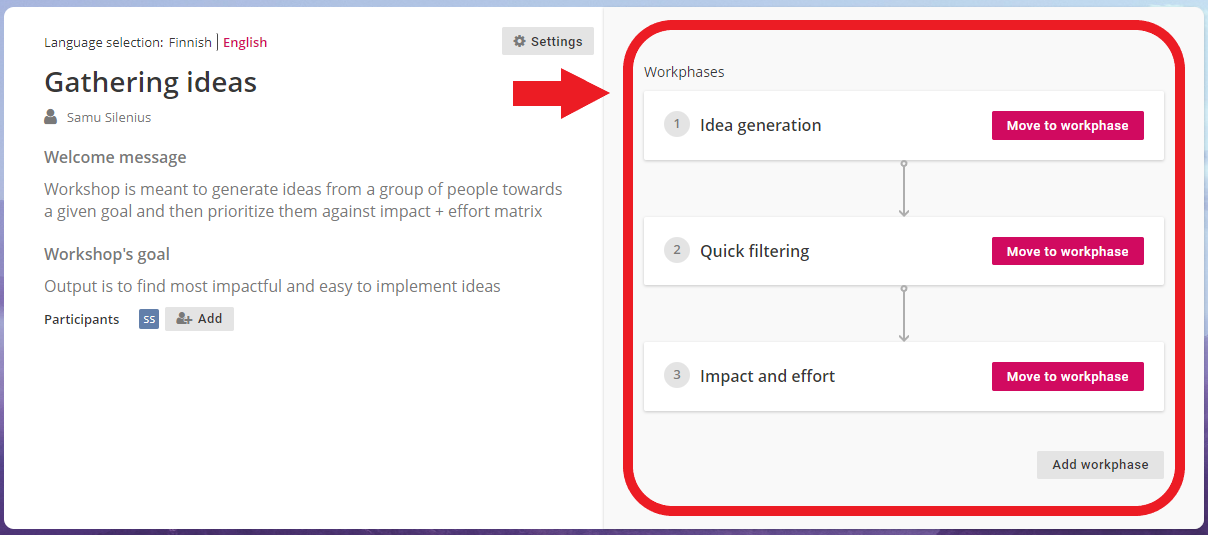
Seeing the structure of the workshop helps the participants to prepare what's about to come and they can also use it to navigate the workshop. The structure is visible at all times - on the front page and each work phase.
Front page lists all work phases in order and participants can access active work phases by clicking "Move to work phase":
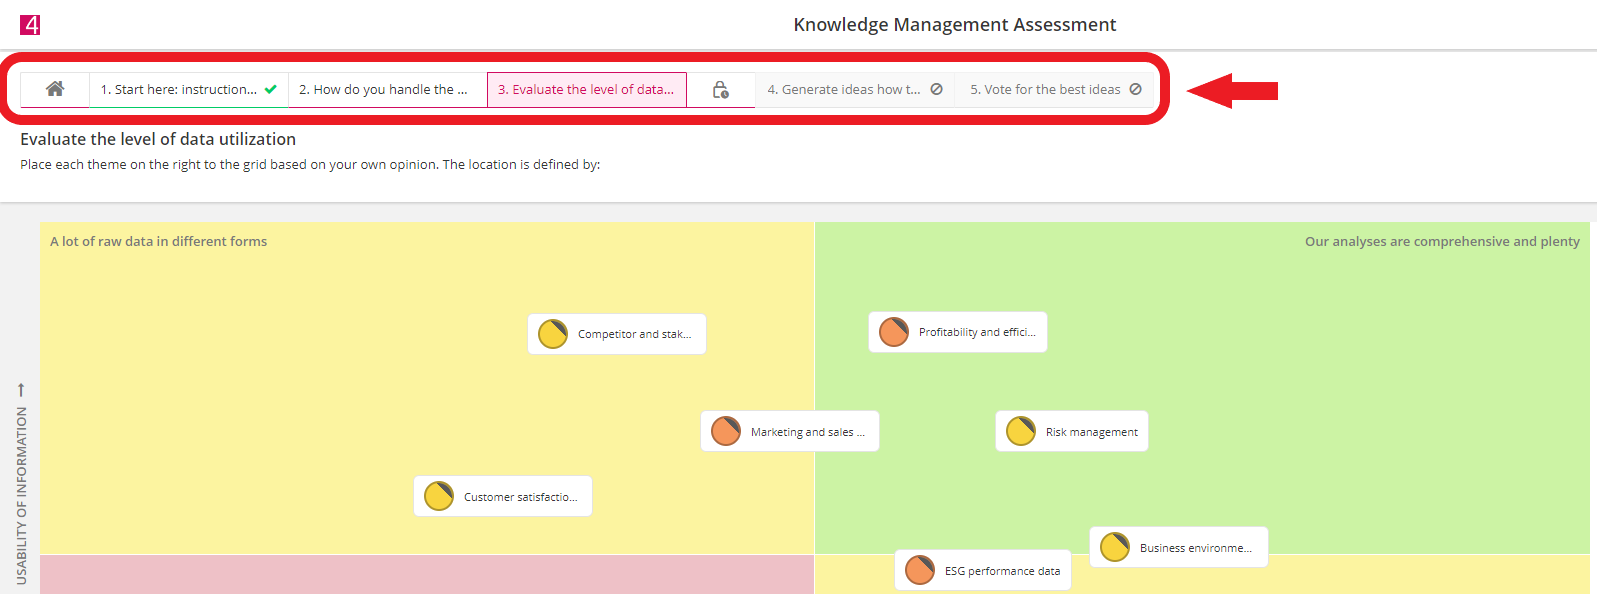
When in a work phase, the structure can be seen on the top and users can click on a work phase to navigate there. This view also shows possible work phase group dividers (= lock icon), if there are some:
3. Chaining work phases
Some work phases have settings that allow you to chain them together, e.g. by choosing to use the results of another work phase as a structure guiding work in future work phases. This allows you to create smoother workflows since you don't have to hold any unnecessary pauses during the workshop. Chaining can also help you reduce the amount of manual work needed in facilitating the workshop as you can chain the work phases before the workshop begins and focus on the actual facilitating instead of data entry, data transfer between work phases etc. Chaining possibilities also enable the construction of workshop series as work phases from different workshops can be chained together.
Chaining settings can be found from identification, two-dimensional rating, comparison analysis and prioritization work phase types:
- Identification phases can have their category types or cards imported from other work phases' results or strategy structures
- Two-dimensional rating phases can have the rated items imported from one or several work phases
- Comparison analysis phases can have the rated items imported from another work phase's results
- Prioritization phases can have the rated items imported from one or several work phases
Below are a few examples how work phases can be chained together:
- Rating identified items: Participants first identify items in X work phases that focus on different topics. Then, the identified items are prioritized or rated either all categories at once or each category separately.
- Rating X best items: Participants first identify items and then complete a prioritization for them. Lastly, they complete a two-dimensional rating for the 10 most-voted items in order to find which ideas should be implemented. Note that the prioritization and rating phases can switch places here depending on the need.
- Iterative rating: Participants first identify items. Then, they start rating them in a two-dimensional rating that repeats a few times, but with each rating having a decreasing amount of best-rated items from the previous rating. For example, 20 items are identified and rated. Then, the second rating would have 15 and the third and final rating would have 10 items. This type of approach can be used in iterative workshop approaches, where there is a need to gradually limit the amount of rated items and have a possibility for discussion in between the ratings.
- Solving X worst issues: Participants start by rating items that are inserted beforehand by the facilitator (either via manual input or importing from e.g. strategy structures). The X worst-rated items then form the categories in a following identification phase, where the participants need to come up with ideas how to improve/solve them. Then these ideas are prioritized or rated to find out the most viable ones for implementation.
4. Work phase statuses
Work phase status dictates their visibility and available functions to participants. Work phase statuses are manageable only by facilitators. There are five different work phase statuses:
- Unpublished, where the work phase contents are visible and accessible only by the facilitator. This status is good for editing the contents or settings of the work phase, or if you want to limit the participants' access only to a couple work phases at a time. Some settings can only be managed if the work phase is "unpublished".
- Published, where the work phase contents and instructions are visible to participants, but they cannot interact with them yet. This status is good for showing work phases that will be completed soon, but you want the participants to complete other work phases first.
- Active, where the participants can interact with the workshop content and "mark it as complete" once they are done.
- Paused, where the work phase is momentarily set as inactive by the facilitator. This status is good if you need to make quick adjustments during the workshop and you want to preserve any content that the participants have produced.
- Completed, where the whole work phase is marked completed and participants can't make changes to their answers anymore. Completing the work phase will also show its results, so that all participants can see and potentially discuss about them. The facilitator can insert the summary notes only after the work phase is completed.